This is my question
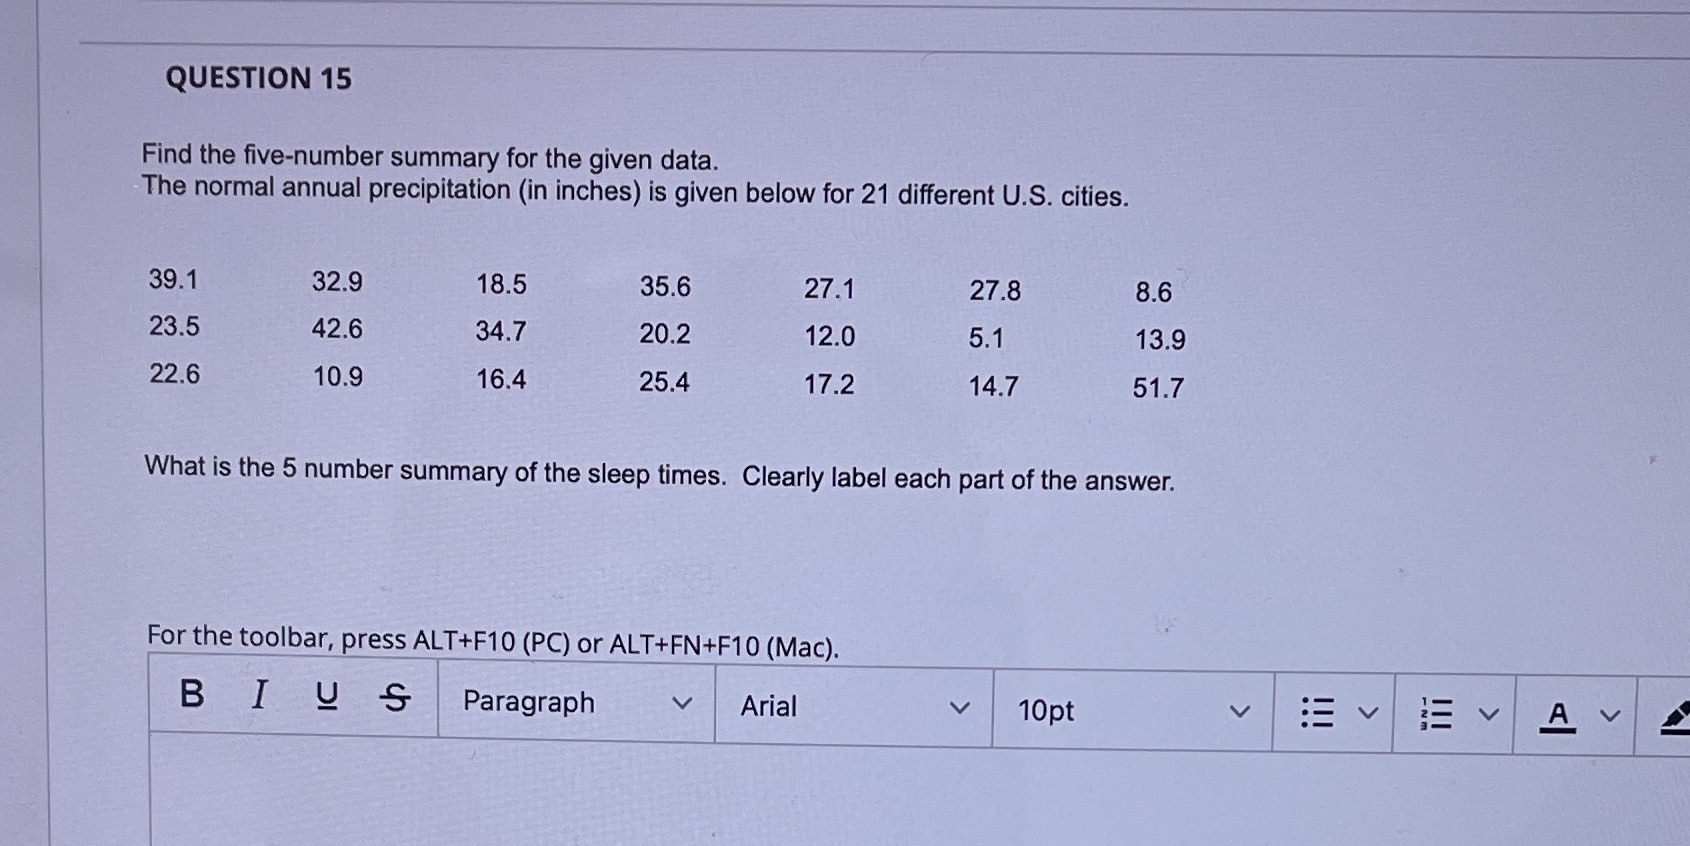
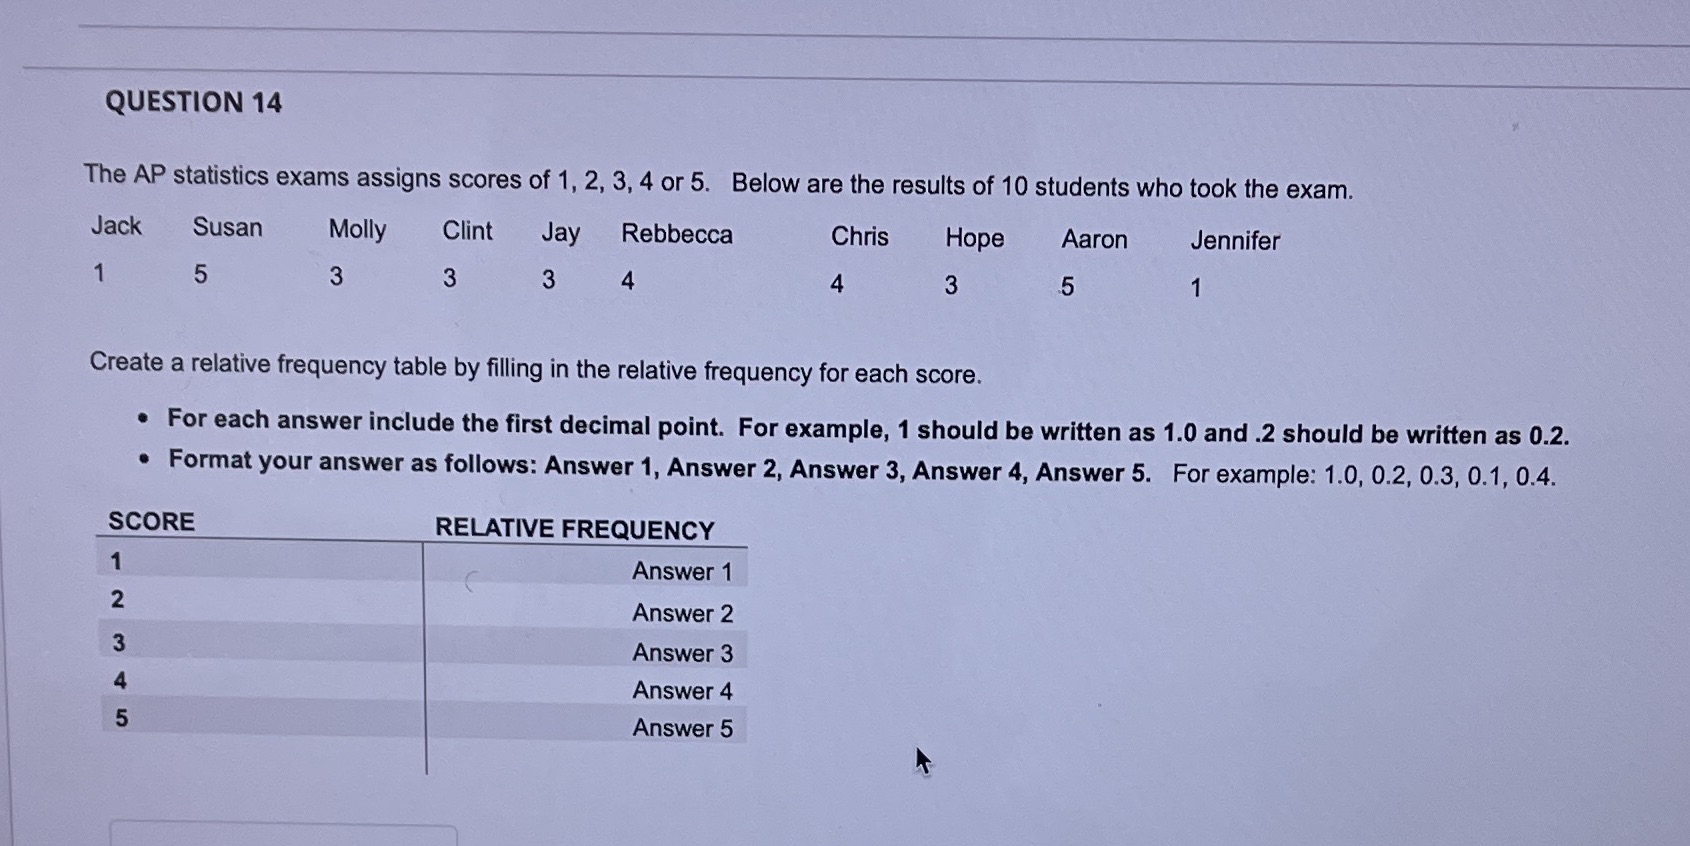
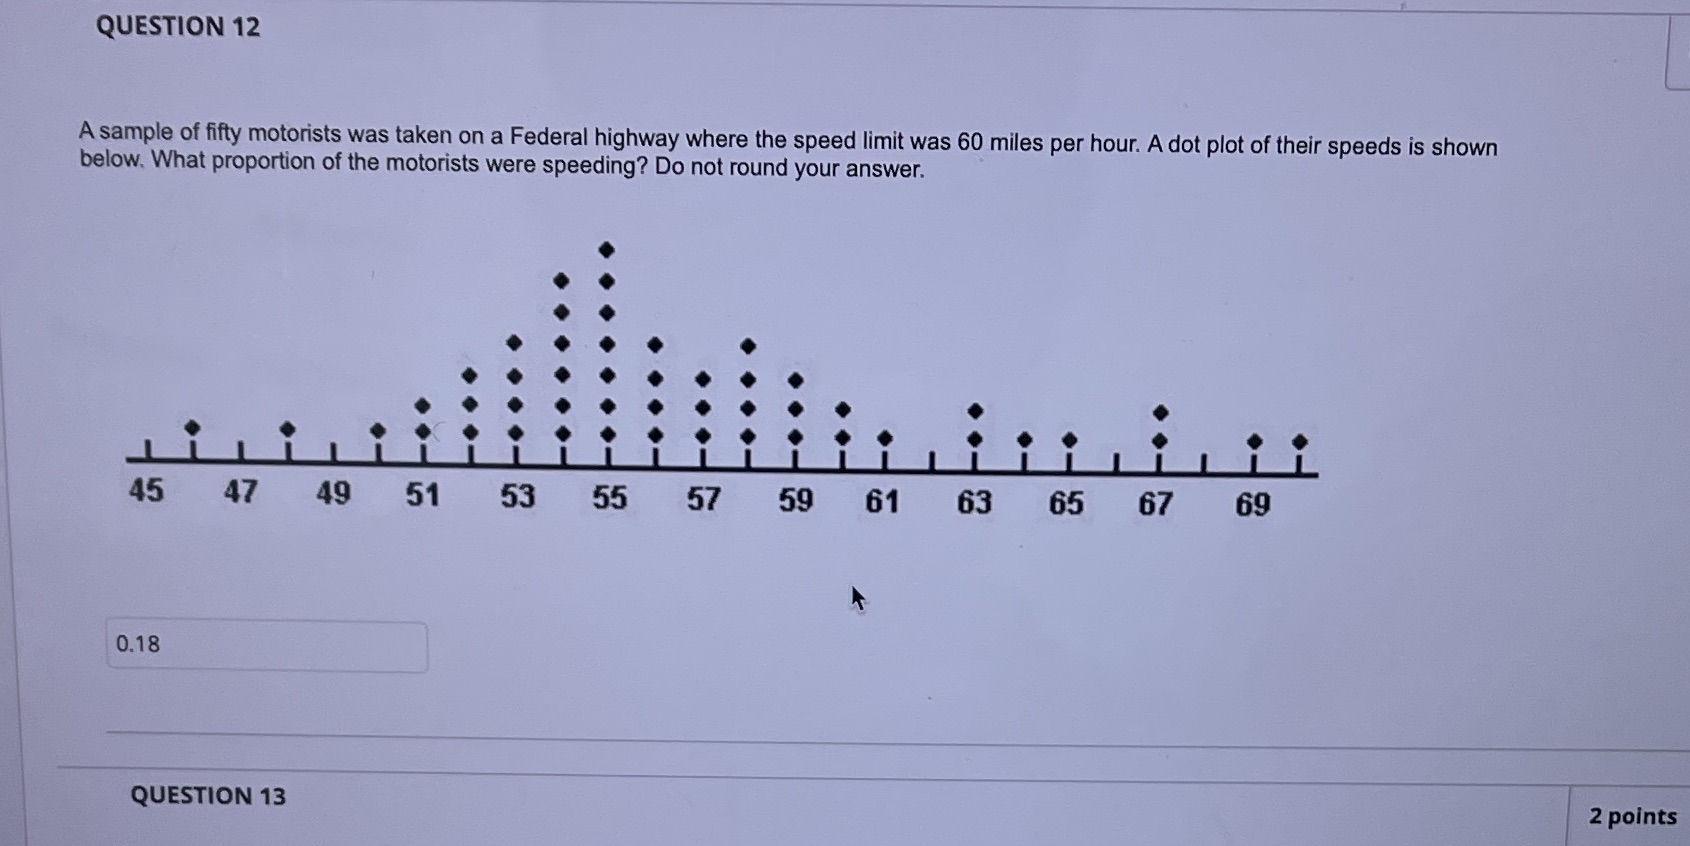
QUESTION 15 Find the five-number summary for the given data. The normal annual precipitation (in inches) is given below for 21 different U.S. cities. 39.1 32.9 18.5 35.6 27.1 27.8 8.6 23.5 42.6 34.7 20.2 12.0 5.1 13.9 22.6 10.9 16.4 25.4 17.2 14.7 51.7 What is the 5 number summary of the sleep times. Clearly label each part of the answer. For the toolbar, press ALT+F10 (PC) or ALT+FN+F10 (Mac). BIUS Paragraph V Arial V 10pt V v A vQUESTION 14 The AP statistics exams assigns scores of 1, 2, 3, 4 or 5. Below are the results of 10 students who took the exam. Jack Susan Molly Clint Jay Rebbecca Chris Hope Aaron Jennifer 5 3 3 3 4 4 3 5 Create a relative frequency table by filling in the relative frequency for each score. . For each answer include the first decimal point. For example, 1 should be written as 1.0 and .2 should be written as 0.2. . Format your answer as follows: Answer 1, Answer 2, Answer 3, Answer 4, Answer 5. For example: 1.0, 0.2, 0.3, 0.1, 0.4. SCORE RELATIVE FREQUENCY Answer 1 Answer 2 U A W N - Answer 3 Answer 4 Answer 5QUESTION 12 A sample of fifty motorists was taken on a Federal highway where the speed limit was 60 miles per hour. A dot plot of their speeds is shown below. What proportion of the motorists were speeding? Do not round your answer. 45 47 49 51 53 55 57 59 61 63 65 67 69 0.18 QUESTION 13 2 pointsQUESTION 10 2 25- 20- 15- Number of People 10- 5 1 2 3 4 5 6 Years of Education Beyond High School This histogram shows the number of people in a recent survey who had between 1 and 6 years of education beyond high school. What was the mode of years of education beyond high school? (Answer with the number only.)QUESTION 1 Match each of the quantities with the appropriate symbol. Mean calculated from sample data. A. P Proportion calculated from sample data. B. X Mean calculated from population data. C. H Proportion calculated from population data. .p QUESTION 2QUESTION 17 3 points Saved Test scores for a history class had a mean of 79 with a standard deviation of 4.5. Test scores for a physics class had a mean of 69 with a standard deviation of 3.7. Suppose a student gets a 68 on the history test and a 87 on the physics test. Calculate the z-score for each test. On which test did the student perform better and why? Round your answers to 2 decimal places. Clearly label each response and type out your work. For the toolbar, press ALT+F10 (PC) or ALT+FN+F10 (Mac). BIUS Paragraph Arial 10pt V A TX . .. the score in physics is much higher than that in history class since z for history class is -2.44 and z for physics is 4.86 P 25 WORDS POWERED BY TINY Click Save and Submit to save and submit. Click Save All Answers to save all answers,3 points Save Answer Consider flipping 2 fair coins. One coin is blue and one yellow. The blue coin has a 2 on one side and a 1 on the other. The yellow coin has a 2 on one side and a 3 on the other. The coins are pictured below. 2 W The coins will be flipped and the sum of will be recorded. What is the probability of the sum being odd? Write your answer in decimal point form, for example 0.1 and do notround.QUESTION 39 3 points Save A Consider flipping 2 fair coins. One coin is blue and one yellow. The blue coin has a 2 on one side and a 1 on the other. The yellow coin has a 2 on one side and a 3 on the other. The coins are pictured below. N 2 W The coins will be flipped and the sum of will be recorded. What is the probability of the sum being 4 or greater? Write your answer in decimal point form, for example 0.10. Do not round your answer.QUESTION 14 The AP statistics exams assigns scores of 1, 2, 3, 4 or 5. Below are the results of 10 students who took the exam. Jack Susan Molly Clint Jay Rebbecca Chris Hope Aaron Jennifer 5 3 3 3 4 4 3 5 Create a relative frequency table by filling in the relative frequency for each score. . For each answer include the first decimal point. For example, 1 should be written as 1.0 and .2 should be written as 0.2. . Format your answer as follows: Answer 1, Answer 2, Answer 3, Answer 4, Answer 5. For example: 1.0, 0.2, 0.3, 0.1, 0.4. SCORE RELATIVE FREQUENCY Answer 1 Answer 2 UI A W N - Answer 3 Answer 4 Answer 5QUESTION 20 2 points S A recent survey asks "Do you strongly agree, agree, disagree or strongly disagree that it is sometimes necessary to discipline a child with a good, hard spanking?" The responses are cross-tabulated with the respondent's gender in the table below. Gender Strongly Agree Agree Disagree Strongly Disagree Total Male 238 419 165 41 863 Female 294 474 237 102 1107 Total 532 893 402 143 1970 How many people participated in the survey? 1970 QUESTION 21 2 points Saved A recent survey asks "Do you strongly agree, agree, disagree or strongly disagree that it is sometimes necessary to discipline a child with a good, hard spanking?" The responses are cross-tabulated with the respondent's gender in the table below. Gender Strongly Agree Agree Disagree Strongly Disagree Total Male 238 419 165 41 863 Female 294 474 237 102 1107 Total 532 893 402 143 1970 How many people disagreed or strongly disagreed? 545QUESTION 25 2 Data were collected on the age (in years) and price (in thousands of dollars) of a random sample of 25 cars. The computer output from a regression analysis is provided. Predictor Coef SE Coef T P Constant 15.2912 0.5840 26.18 0.000 Age -1.7126 0.1264 -13.55 0.000 R-Sq = 88.9% What is the proportion of variation in price of a car that can be explained by the least-squares regression of price of a car on age of a car? 0.889 0.153 0.171 0.943 QUESTION 26 3 po Data were collected on the age (in years) andQUESTION 24 Data were collected on the age (in years) and price (in thousands of dollars) of a random sample of 25 cars. The computer output from a regression analysis is provided. Predictor Coef SE Coef T P Constant 15.2912 0.5840 26.18 0.000 Age -1.7126 0.1264 -13.55 0.000 R-Sq = 88.9% What is the correct equation for the regression line? O age = - 1.71+ 15.29 price price = - 1.71+ 15.29 age O age = 15.29 - 1.71price price = 15.29 - 1.7 lage K QUESTION 252 points Save Answer QUESTION 13 You go to the store to buy ground beef and find the following. Using what you have learned from the course do you have any concerns? Why or why not? TREE GROUND 100% PURE FUTCHERS BEEF CHUCK 81 % Lean 9% Fat COOKTO 160 F at Cal Nutrition bout Per Serving Amount Per Serving XDV Facts Total Fat 21g 33% Total Carb. Og Perce Serv, Size 4 oz. (7129) Sat. Fat 9g 43% 0% Servings Vaned Fiber 0g Calories 230 Cholest. 75mg 25% 0% Fat Calories 190 Sugars 0g Sodium 65mg Percent Dady Votes (ON) 3% Protein 21g VIC based on a 2600 caloric girt Vitamin A OX . Vitamin C 0% . Calclum 0% . Iron 10% SATISFACTION GUARANTEED HARRIS K . . . A v TX For the toolbar, press ALT+F10 (PC) or ALT+FN+F10 (Mac). V 10pt Paragraph V Arial BIUSQUESTION 1 Match each of the quantities with the appropriate symbol. Mean calculated from sample data. A. P Proportion calculated from sample data. B. X Mean calculated from population data. C. H Proportion calculated from population data. D. PQUESTION 2 The statement "Based on previous clients, a marriage counselor concludes that the majority of marriages that begin with cohabitation before marriage will result indivorce" refers to which aspect of a statistical study? Description Inference Design QUESTION 3 2 The statement "The average age of the students in a statistics class is 25 years" refers to which aspect of a statistical study? Description Inference Design QUESTION 4