

Answered step by step
Verified Expert Solution
Question
1 Approved Answer
This is the home info sheet. Please provide exact equations for all. Year 0 Year 1 36,000 Year 2 37.440 Year 3 38,938 Year 4
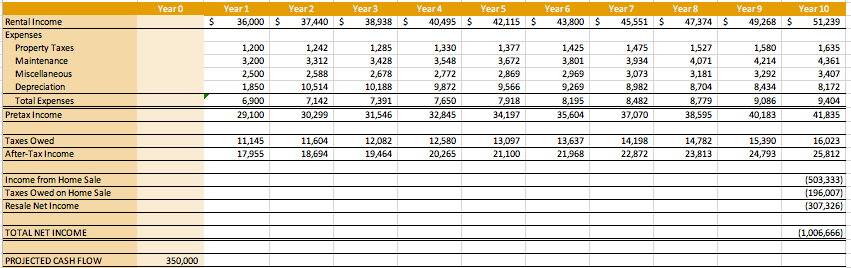
This is the home info sheet.
Please provide exact equations for all.
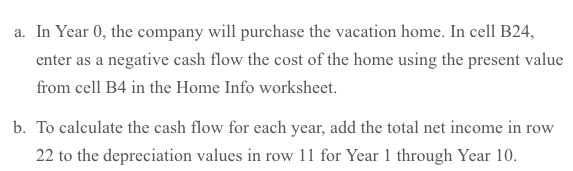
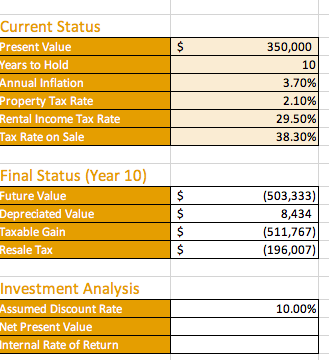
Year 0 Year 1 36,000 Year 2 37.440 Year 3 38,938 Year 4 40,495 $ Year 5 42,115 $ Year 6 43,800 $ Year 7 45,551 Year 8 47,374 $ Year 9 49,268 $ Year 10 51,239 $ $ $ $ $ 1,242 3,312 Rental Income Expenses Property Taxes Maintenance Miscellaneous Depreciation Total Expenses Pretax Income 1,200 3.200 2,500 1,850 6.900 29,100 2,588 10,514 7,142 30,299 1,285 3428 2,678 10,188 7,391 31,546 1,330 3,548 2,772 9,872 7,650 32,845 1,377 3,672 2,869 9,566 7,918 34,197 1.425 3,801 2.969 9,269 8,195 35,604 1,475 3,934 3,073 8,982 8,482 37,070 1,527 4,071 3,181 8,704 8,779 38,595 1,580 4,214 3,292 8,434 9,086 40,183 1,635 4,361 3,407 8,172 9,404 41,835 Taxes Owed After-Tax Income 11.145 17,955 11,604 18,694 12,082 19,464 12,580 20,265 13,097 21,100 13,637 21,968 14,198 22.872 14,782 23,813 15,390 24,793 16,023 25,812 Income from Home Sale Taxes Owed on Home Sale Resale Net Income (503,333) (196,007) (307,326) TOTAL NET INCOME (1,006,666) PROJECTED CASH FLOW 350,000 In the C22:L22 range, determine the yearly net income by adding the after-tax income to the resale net income (note that only in Year 10 is there resale income). a. In Year 0, the company will purchase the vacation home. In cell B24, enter as a negative cash flow the cost of the home using the present value from cell B4 in the Home Info worksheet. b. To calculate the cash flow for each year, add the total net income in row 22 to the depreciation values in row 11 for Year 1 through Year 10. $ Current Status Present Value Years to Hold Annual Inflation Property Tax Rate Rental Income Tax Rate Tax Rate on Sale 350,000 10 3.70% 2.10% 29.50% 38.30% Final Status (Year 10) Future Value Depreciated Value Taxable Gain Resale Tax $ $ $ $ (503,333) 8,434 (511,767) (196,007) Investment Analysis Assumed Discount Rate Net Present Value Internal Rate of Return 10.00% Year 0 Year 1 36,000 Year 2 37.440 Year 3 38,938 Year 4 40,495 $ Year 5 42,115 $ Year 6 43,800 $ Year 7 45,551 Year 8 47,374 $ Year 9 49,268 $ Year 10 51,239 $ $ $ $ $ 1,242 3,312 Rental Income Expenses Property Taxes Maintenance Miscellaneous Depreciation Total Expenses Pretax Income 1,200 3.200 2,500 1,850 6.900 29,100 2,588 10,514 7,142 30,299 1,285 3428 2,678 10,188 7,391 31,546 1,330 3,548 2,772 9,872 7,650 32,845 1,377 3,672 2,869 9,566 7,918 34,197 1.425 3,801 2.969 9,269 8,195 35,604 1,475 3,934 3,073 8,982 8,482 37,070 1,527 4,071 3,181 8,704 8,779 38,595 1,580 4,214 3,292 8,434 9,086 40,183 1,635 4,361 3,407 8,172 9,404 41,835 Taxes Owed After-Tax Income 11.145 17,955 11,604 18,694 12,082 19,464 12,580 20,265 13,097 21,100 13,637 21,968 14,198 22.872 14,782 23,813 15,390 24,793 16,023 25,812 Income from Home Sale Taxes Owed on Home Sale Resale Net Income (503,333) (196,007) (307,326) TOTAL NET INCOME (1,006,666) PROJECTED CASH FLOW 350,000 In the C22:L22 range, determine the yearly net income by adding the after-tax income to the resale net income (note that only in Year 10 is there resale income). a. In Year 0, the company will purchase the vacation home. In cell B24, enter as a negative cash flow the cost of the home using the present value from cell B4 in the Home Info worksheet. b. To calculate the cash flow for each year, add the total net income in row 22 to the depreciation values in row 11 for Year 1 through Year 10. $ Current Status Present Value Years to Hold Annual Inflation Property Tax Rate Rental Income Tax Rate Tax Rate on Sale 350,000 10 3.70% 2.10% 29.50% 38.30% Final Status (Year 10) Future Value Depreciated Value Taxable Gain Resale Tax $ $ $ $ (503,333) 8,434 (511,767) (196,007) Investment Analysis Assumed Discount Rate Net Present Value Internal Rate of Return 10.00%Step by Step Solution
There are 3 Steps involved in it
Step: 1

Get Instant Access to Expert-Tailored Solutions
See step-by-step solutions with expert insights and AI powered tools for academic success
Step: 2

Step: 3
Ace Your Homework with AI
Get the answers you need in no time with our AI-driven, step-by-step assistance
Get Started
Impact Investing In Africa A Guide To Sustainability For Investors Institutions And Entrepreneurs
Authors: Edward Mungai
1st Edition
3030004279,3030004287