this is the same exercise but i had to take multiple screenshoot to show everything
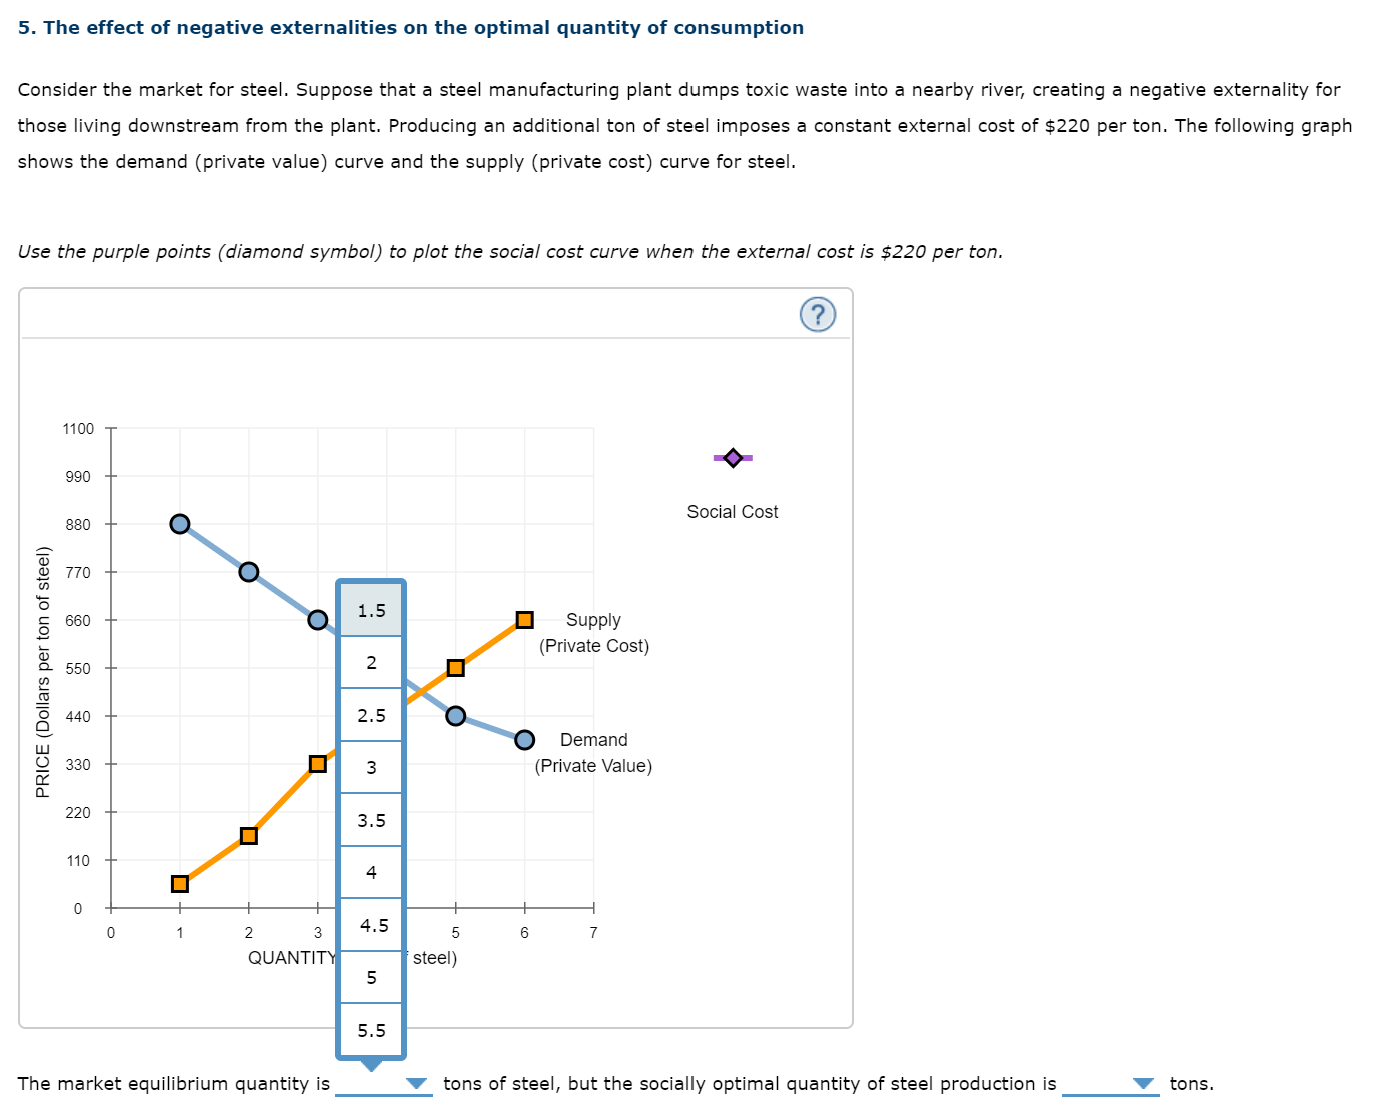
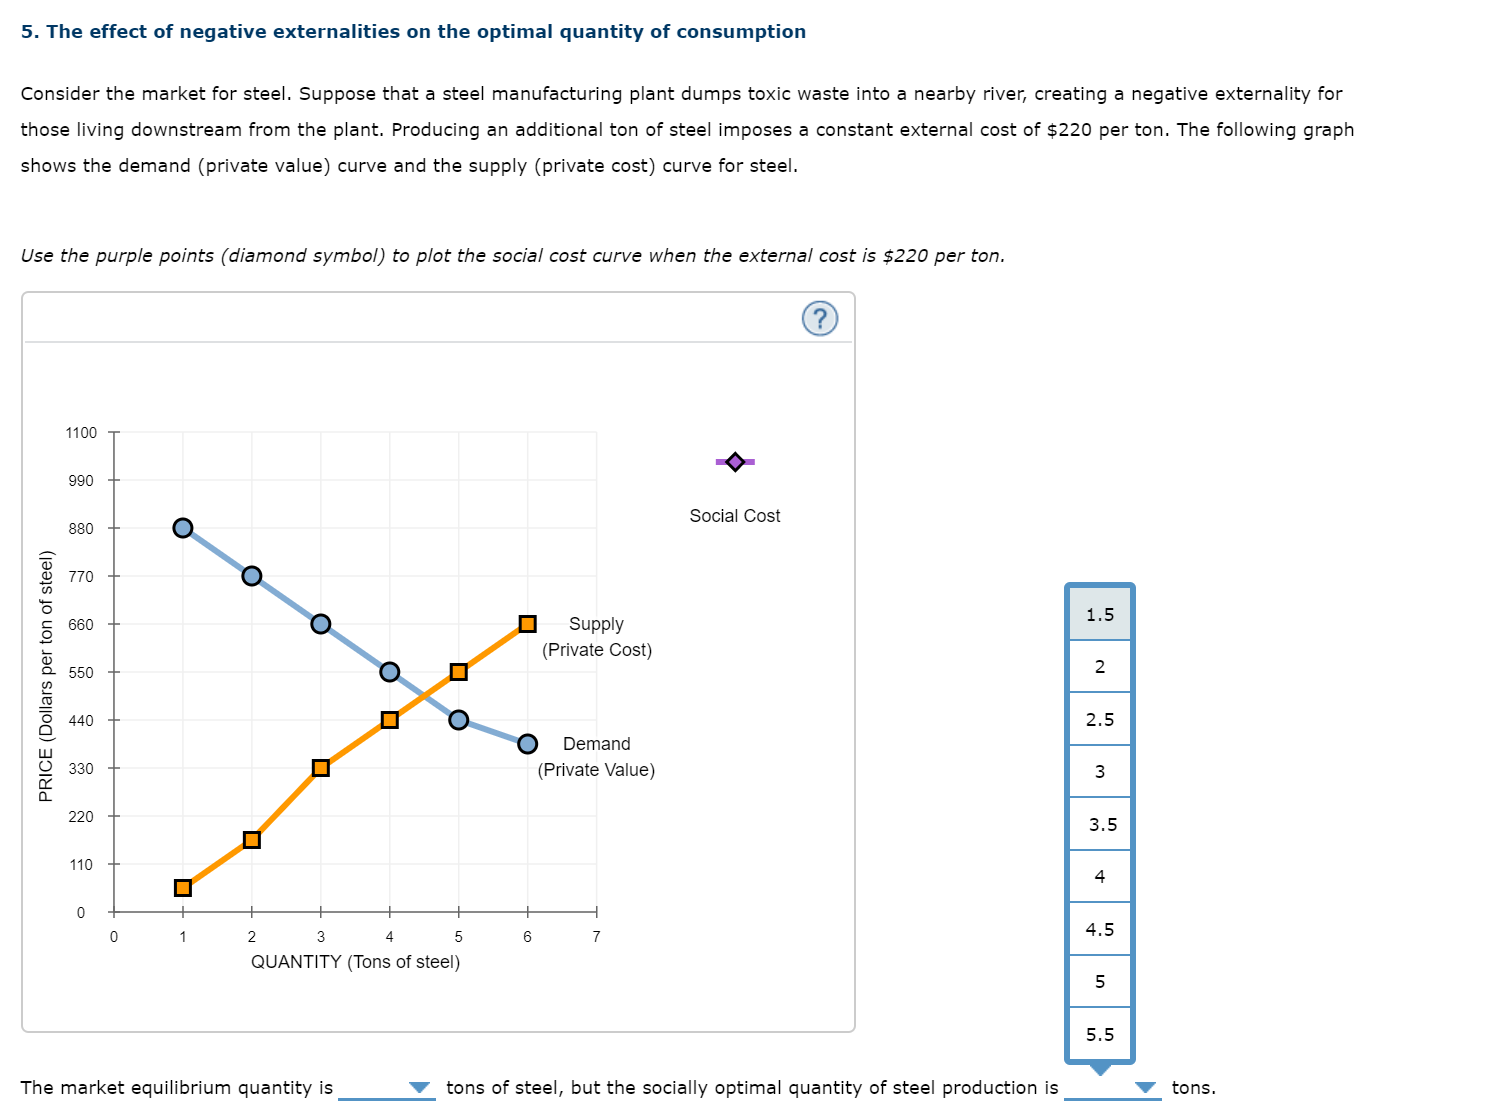
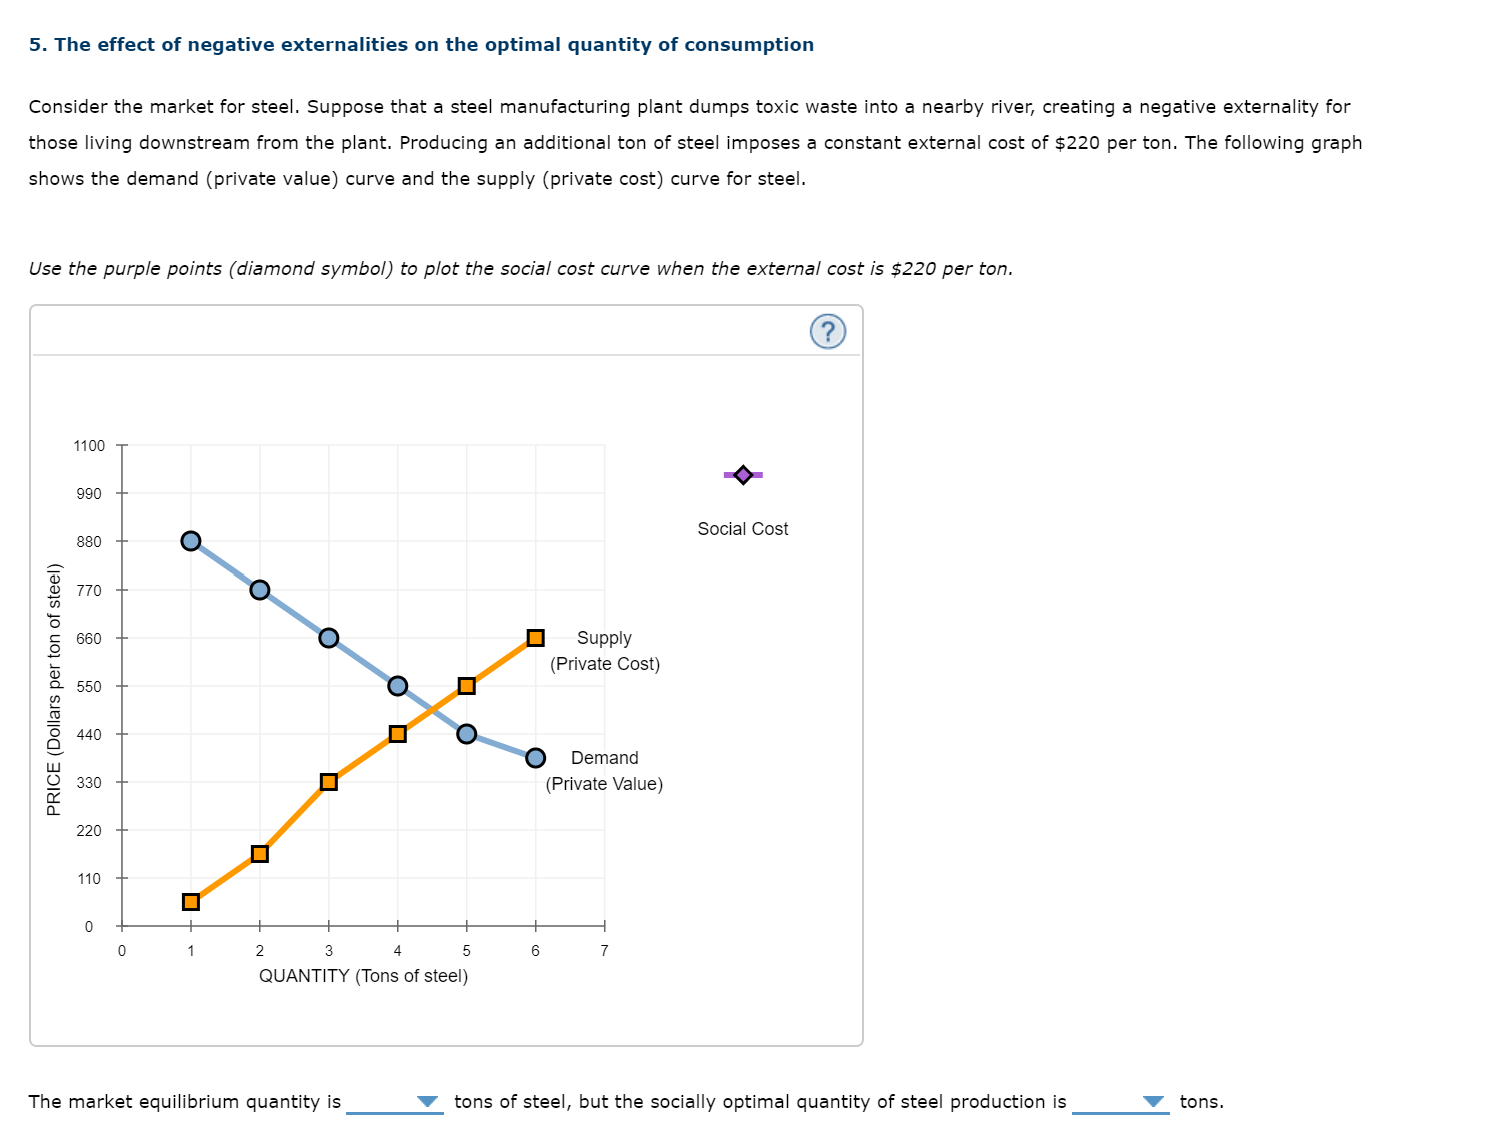
5. The effect of negative externalities on the optimal quantityr of consumption Consider the market for steel. Suppose that a steel manufacturing plant dumps toxic waste into a nearby river, creating a negative externality for those living downstream from the plant. Producing an additional ton of steel imposes a constant external cost of $220 per ton. The following graph shows the demand (private value) curve and the supply (private cost) curve for steel. Use the purple points (diamond symbol) to plot the social cost curve when the external cost is $220 per ton. 1100 + Social Cost 990 880 7?0 660 Supply (Private Cost) 550 440 Demand 330 {Private Value} PRICE (Dollars per ion of sleel) 220 110 The market equilibrium quantity is V tons of steel, but the socially optimal quantity of steel production is V tons. 5. The effect of negative externalities on the optimal quantity of consumption Consider the market for steel. Suppose that a steel manufacturing plant dumps toxic waste into a nearby river, creating a negative externality for those living downstream from the plant. Producing an additional ton of steel imposes a constant external cost of $220 per ton. The following graph shows the demand (private value} curve and the supply (private cost} curve for steel. Use the purple points (diamond symbol) to plot the social cost curve when the external cost is $220 per ton. 1100 990 Social Cost 830 f 2 770 in '5 E 660 Supply E E (Private Cost) CL 550 E 2 a I Demand E 330 (Private Value} I n. 110 0 0 1 2 3 4 5 a 7 4-5 QUANTITY (Tons of steel) The market equilibrium quantity is V tons of steel, but the socially optimal quantity of steel production is V tons. 5. The effect of negative externalities on the optimal quantity of consumption Consider the market for steel. Suppose that a steel manufacturing plant dumps toxic waste into a nearby river, creating a negative externality for those living downstream from the plant. Producing an additional ton of steel imposes a constant external cost of $220 per ton. The following graph shows the demand (private value) curve and the supply (private cost) curve for steel. Use the purple points ( diamond symbol) to plot the social cost curve when the external cost is $220 per ton. 1100 990 Social Cost 830 E 2 770 in '5 E 660 Supply E (Private Cost} D- 550 E E g 440 E Demand 5 330 (Private Value) n. 220 110 0 0 1 2 3 4 5 5 7 QUANTITY (Tons of steel) The market equilibrium quantity is V tons of steel, but the socially optimal quantity of steel production is 'V' tons


