

Question: (1) The table shows the position of a cyclist 1 2 3.1 12.4 t(seconds) s (feet) 0 0 3 27.9 41 (Express answers using
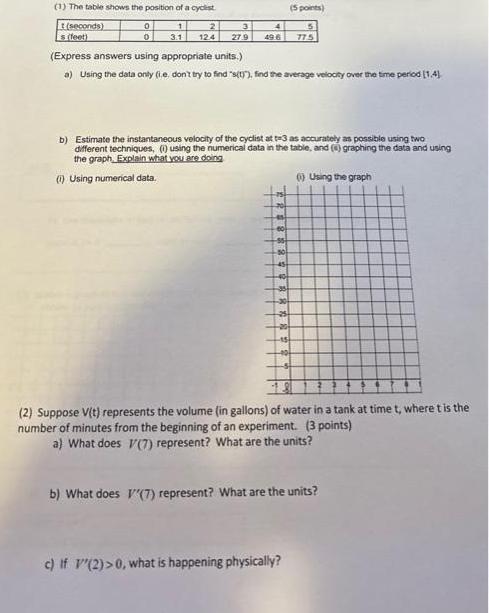
(1) The table shows the position of a cyclist 1 2 3.1 12.4 t(seconds) s (feet) 0 0 3 27.9 41 (Express answers using appropriate units.) a) Using the data only (ie, don't try to find "s(t)), find the average velocity over the time period (1.4) 45 60 -55 -50 45 -40 35 b) Estimate the instantaneous velocity of the cyclist at t-3 as accurately as possible using two different techniques, () using the numerical data in the table, and () graphing the data and using the graph, Explain what you are doing (1) Using numerical data. -30 25 (5 points) -15 5 77.5 c) If '(2) >0, what is happening physically? () Using the graph (2) Suppose V(t) represents the volume (in gallons) of water in a tank at time t, where t is the number of minutes from the beginning of an experiment. (3 points) a) What does V(7) represent? What are the units? b) What does '(7) represent? What are the units?
Step by Step Solution
3.42 Rating (152 Votes )
There are 3 Steps involved in it
1 a To find the average velocity over the time period 14 use the formula Average Velocity Change in Position Change in Time First calculate the change ... View full answer

Get step-by-step solutions from verified subject matter experts