**This is timed. Don't take longer than 90 min to answer** The accompanying table shows the height (in inches) of 8 high school girls and
**This is timed. Don't take longer than 90 min to answer**
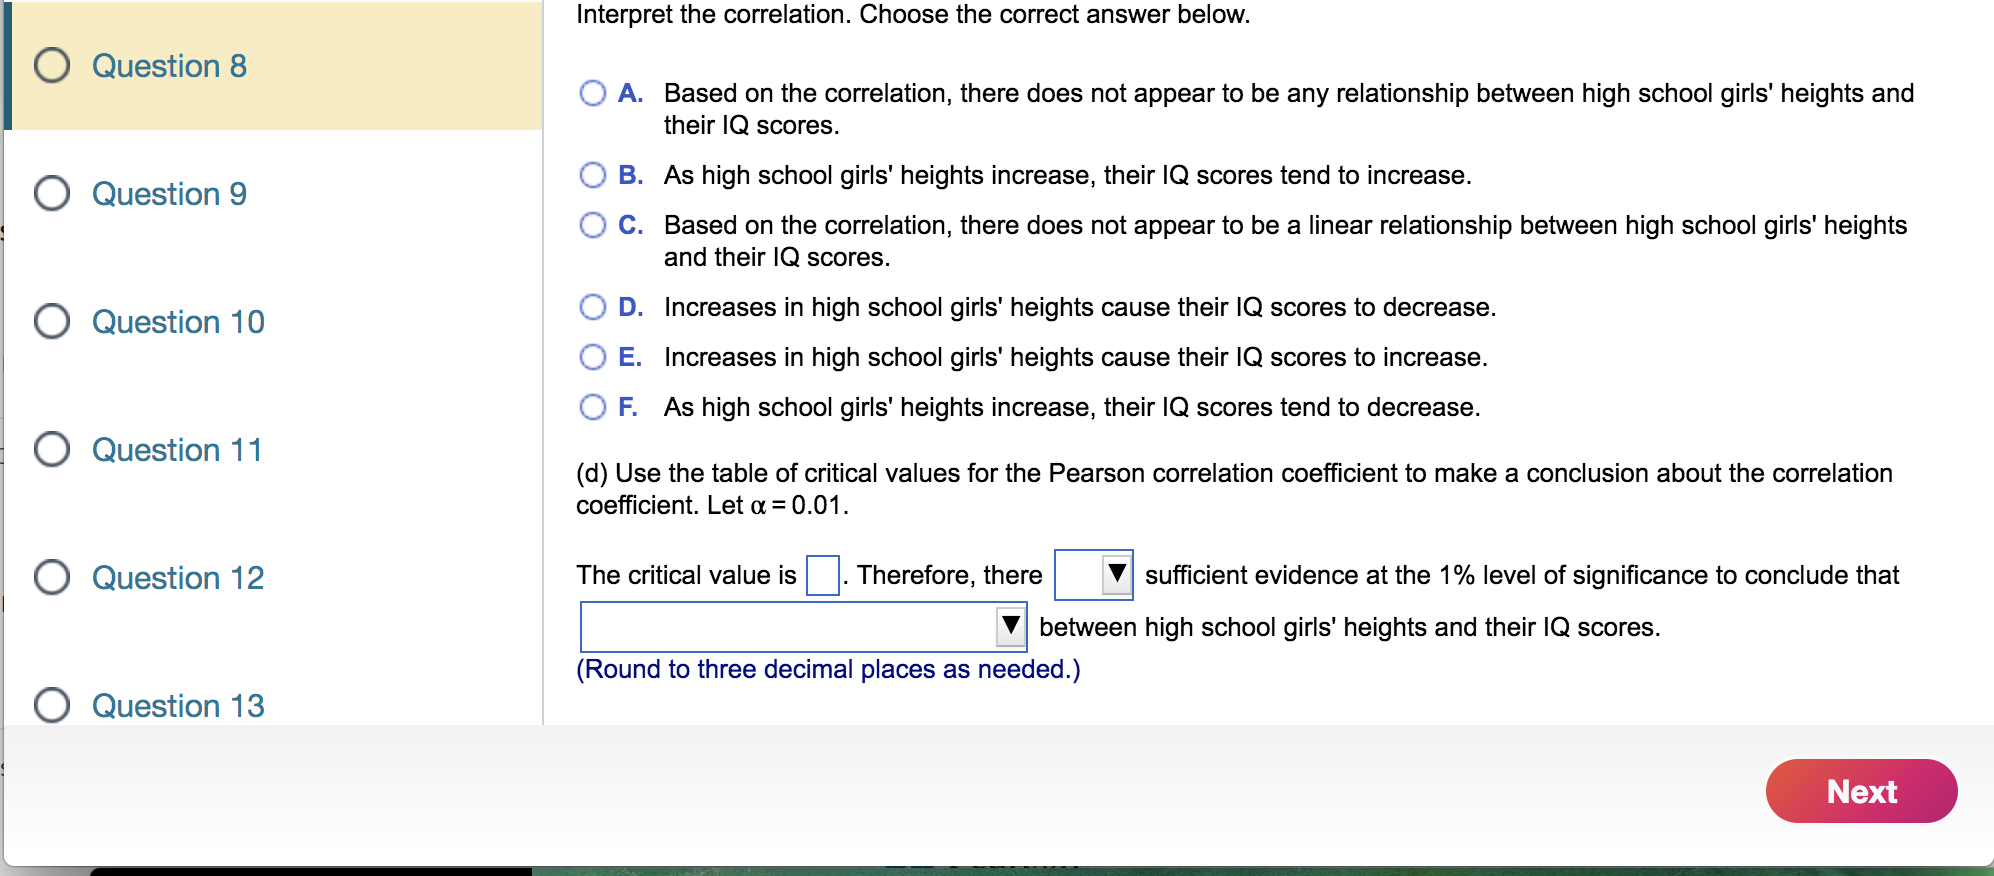
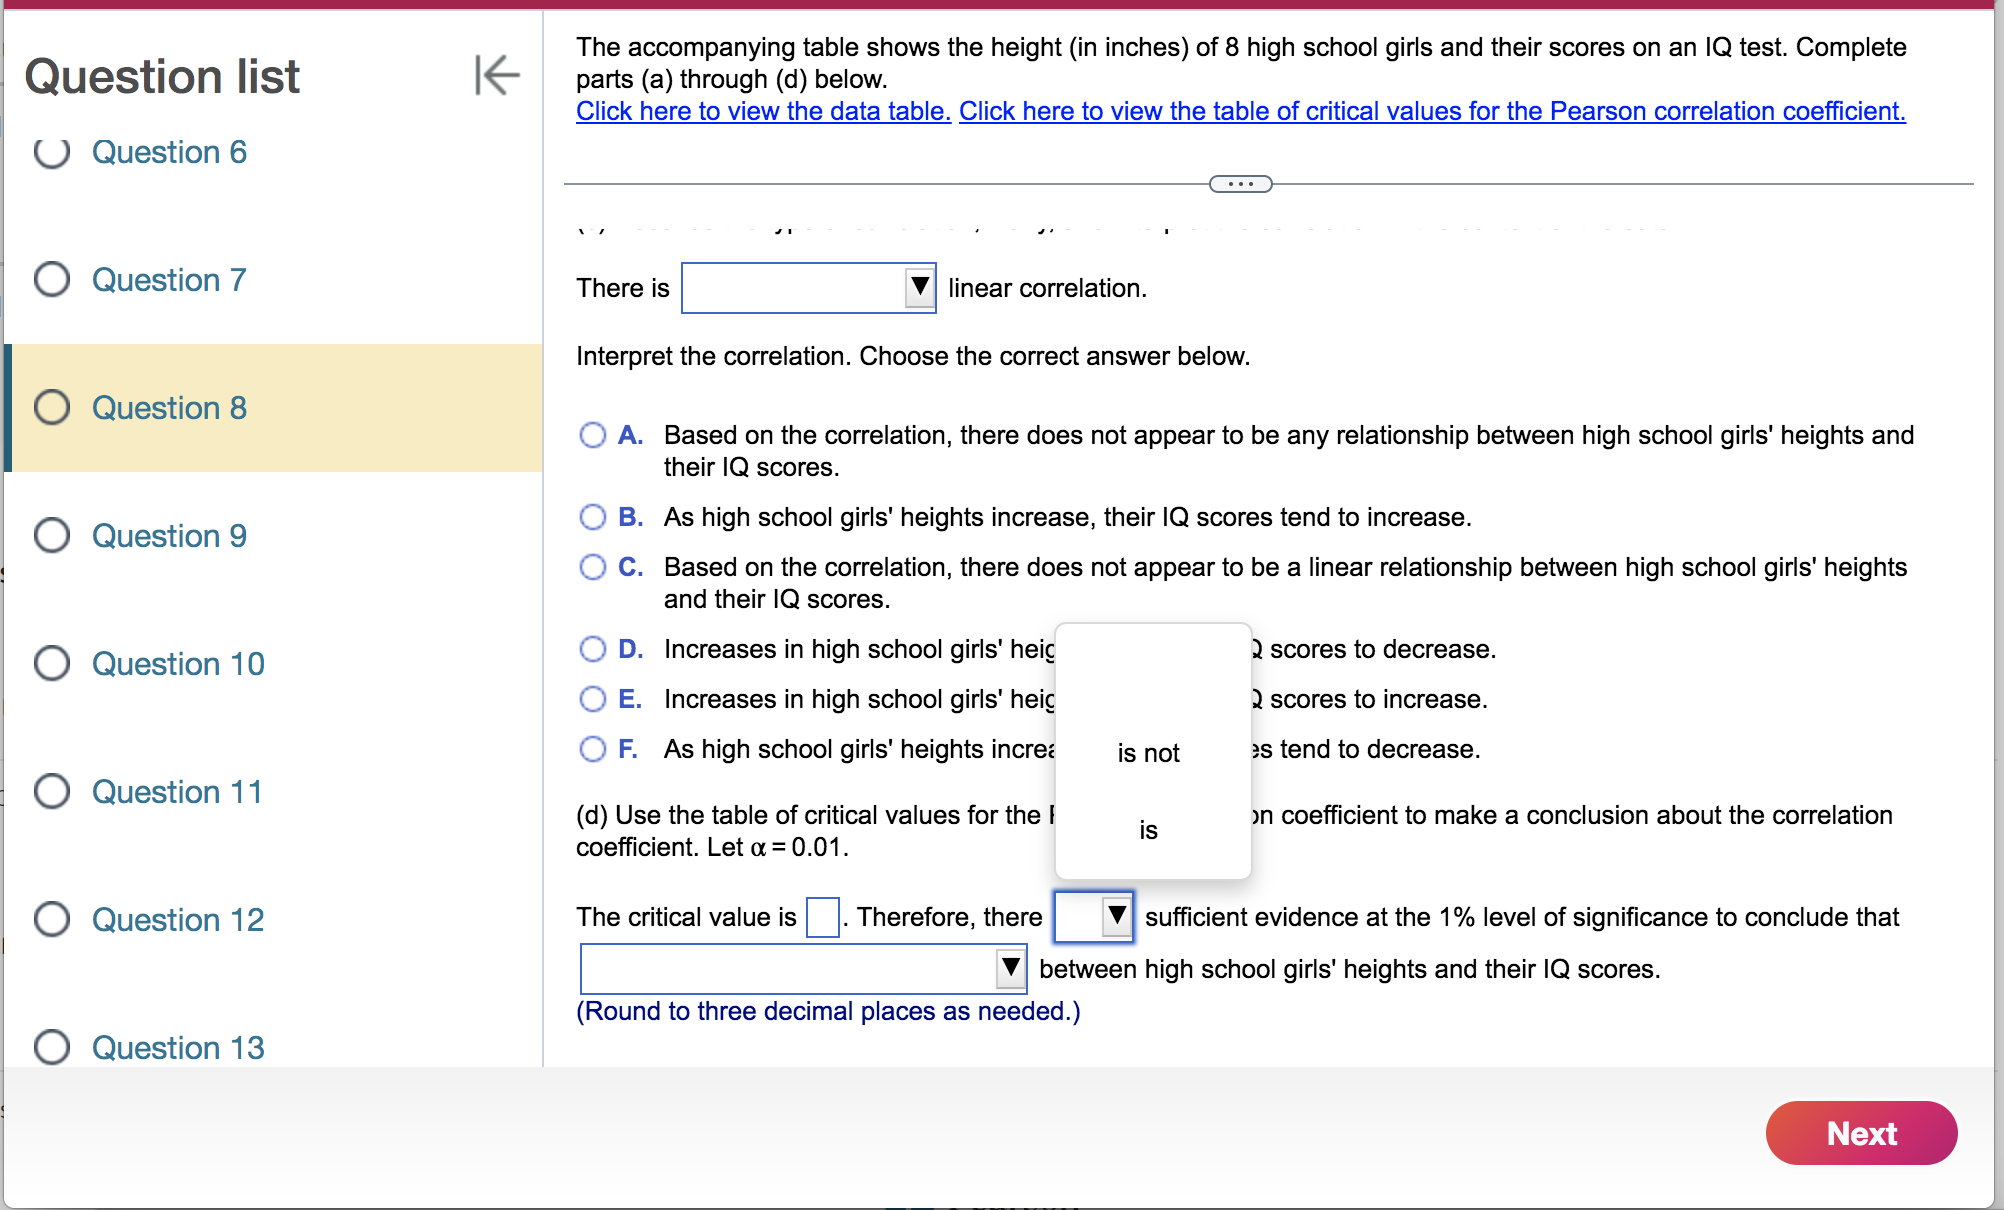
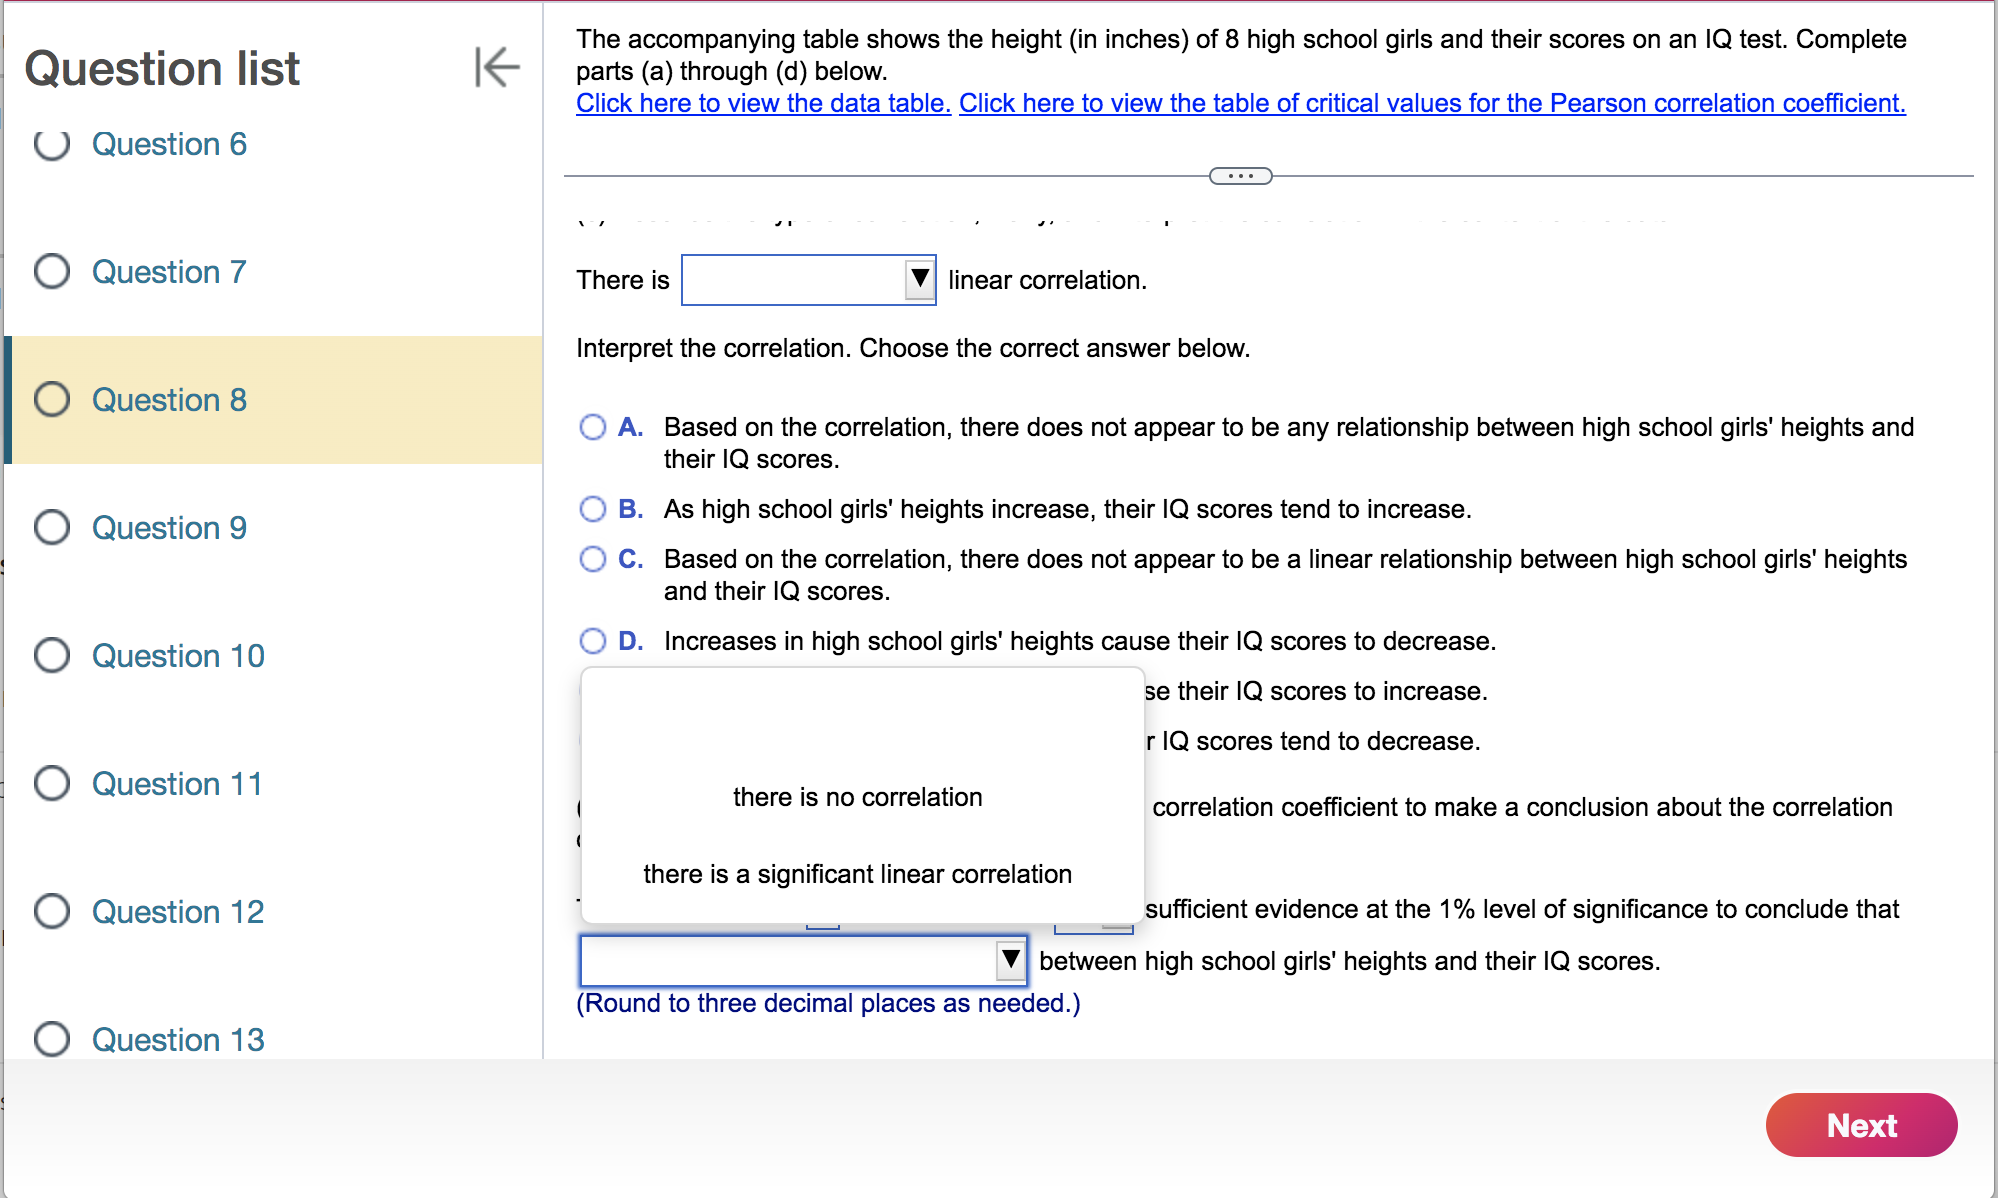
The accompanying table shows the height (in inches) of 8 high school girls and their scores on an IQ test. Complete Question list K parts (a) through (d) below. Click here to view the data table. Click here to view the table of critical values for the Pearson correlation coefficient. Question 6 O Question 7 (a) Display the data in a scatter plot. Choose the correct graph below. O A. OB. O C. O D. 140- 140- 68 1 68- O Question 8 1307 130 64- 64- 120- 120- Q score IQ score 1Q score 60- IQ score 60- 110- 110- O Question 9 100- 100- 56- 56- 90+ 90- 52- 52- 52 68 52 68 90 140 90 140 Height (inches) Height (inches) Height (inches) Height (inches) O Question 10 (b) Calculate the sample correlation coefficient r. r=0 O Question 11 (Round to three decimal places as needed.) (c) Describe the type of correlation, if any, and interpret the correlation in the context of the data. O Question 12 There is linear correlation. Interpret the correlation. Choose the correct answer below. O Question 13 . . NextQuestion list K The accompanying table shows the height (in inches) of 8 high school girls and their scores on an IQ test. Complete parts (a) through (d) below. Click here to view the data table. Click here to view the table of critical values for the Pearson correlation coefficient. Question 6 O Question 7 (a) Displa pse the correct graph below. O A. O C. O D. a perfect negative O Question 8 140- 68- 68- 130- a moderate positive 64- 64- 120- 2 score IQ score 60- IQ score 110- 60- 100- a perfect positive 56- 56- O Question 9 90+ 52- 52-+ no 68 90 140 90 140 ight (inches) Height (inches) Height (inches) O Question 10 (b) Calcu a strong negative cient r. r= a strong positive O Question 11 (Round to J.) (c) Descr a moderate negative and interpret the correlation in the context of the data. Question 12 There is linear correlation. Interpret the correlation. Choose the correct answer below. O Question 13 NextInterpret the correlation. Choose the correct answer below. O Question 8 O A. Based on the correlation, there does not appear to be any relationship between high school girls' heights and their IQ scores. O Question 9 O B. As high school girls' heights increase, their IQ scores tend to increase. O C. Based on the correlation, there does not appear to be a linear relationship between high school girls' heights and their IQ scores. O Question 10 O D. Increases in high school girls' heights cause their IQ scores to decrease. O E. Increases in high school girls' heights cause their IQ scores to increase. O F. As high school girls' heights increase, their IQ scores tend to decrease. O Question 11 (d) Use the table of critical values for the Pearson correlation coefficient to make a conclusion about the correlation coefficient. Let a = 0.01. O Question 12 The critical value is . Therefore, there sufficient evidence at the 1% level of significance to conclude that between high school girls' heights and their IQ scores. (Round to three decimal places as needed.) O Question 13 NextThe accompanying table shows the height (in inches) of 8 high school girls and their scores on an IQ test. Complete Question list K parts (a) through (d) below. Click here to view the data table. Click here to view the table of critical values for the Pearson correlation coefficient. Question 6 O Question 7 There is linear correlation. Interpret the correlation. Choose the correct answer below. O Question 8 O A. Based on the correlation, there does not appear to be any relationship between high school girls' heights and their IQ scores. O Question 9 O B. As high school girls' heights increase, their IQ scores tend to increase. O C. Based on the correlation, there does not appear to be a linear relationship between high school girls' heights and their IQ scores. O Question 10 O D. Increases in high school girls' heig 2 scores to decrease. O E. Increases in high school girls' heig 2 scores to increase. O F. As high school girls' heights increa is not as tend to decrease. Question 11 (d) Use the table of critical values for the I is n coefficient to make a conclusion about the correlation coefficient. Let a = 0.01. O Question 12 The critical value is . Therefore, there sufficient evidence at the 1% level of significance to conclude that between high school girls' heights and their IQ scores. (Round to three decimal places as needed.) O Question 13 NextQuestion list K The accompanying table shows the height (in inches) of 8 high school girls and their scores on an IQ test. Complete parts (a) through (d) below. Click here to view the data table. Click here to view the table of critical values for the Pearson correlation coefficient. Question 6 O Question 7 There is linear correlation. Interpret the correlation. Choose the correct answer below. Question 8 O A. Based on the correlation, there does not appear to be any relationship between high school girls' heights and their IQ scores. O Question 9 O B. As high school girls' heights increase, their IQ scores tend to increase. O C. Based on the correlation, there does not appear to be a linear relationship between high school girls' heights and their IQ scores. O Question 10 O D. Increases in high school girls' heights cause their IQ scores to decrease. se their IQ scores to increase. r IQ scores tend to decrease. O Question 11 there is no correlation correlation coefficient to make a conclusion about the correlation there is a significant linear correlation O Question 12 sufficient evidence at the 1% level of significance to conclude that between high school girls' heights and their IQ scores. (Round to three decimal places as needed.) O Question 13 NextData Table - X Height, x IQ score, y 60 115 56 108 65 111 66 118 58 99 62 115 63 122 56 130 S Print Done aX Critical Values for the Pearson Correlation Coefficient Critical Values for the Pearson Correlation Coefficient The correlation is significant when the absolute value of , is greater than the value in the table. a = 0.05 ( = 0.01 0.950 0.990 VOUAS 0.878 0.959 0.811 0.917 0.754 0.875 8 0.707 0.834 9 0.666 0.798 10 0.632 0.765 11 0.602 0.735 12 0.576 0.708 13 0.553 0.684 14 0.532 0.661 15 0.514 0.641 16 0.497 0.623 17 0.482 0.606 18 0.468 0.590 Print Done
Step by Step Solution
There are 3 Steps involved in it
Step: 1
Get Instant Access to Expert-Tailored Solutions
See step-by-step solutions with expert insights and AI powered tools for academic success
Step: 2
Step: 3
Ace Your Homework with AI
Get the answers you need in no time with our AI-driven, step-by-step assistance