Answered step by step
Verified Expert Solution
Question
1 Approved Answer
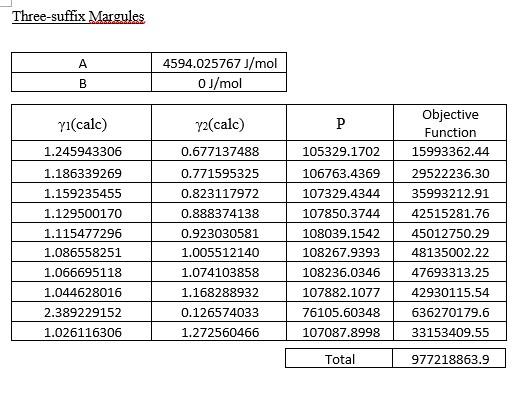
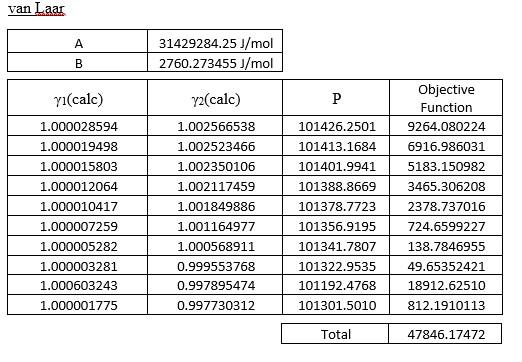
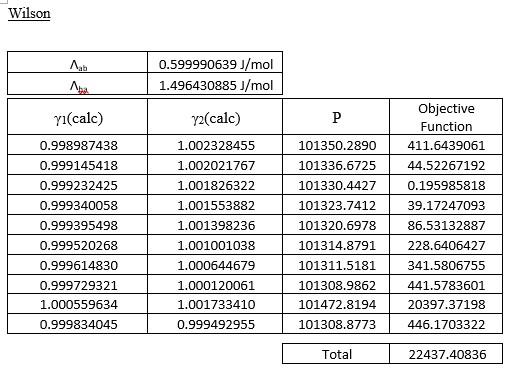
This is VLE of the methanol-benzene system, pls help. Three-suffix Margules A 4594.025767J/mol 0J/mol B yl(cale) Y2(cale) P 1.245943306 0.677137488 105329.1702 106763.4369 107329.4344 1.186339269 1.159235455


This is VLE of the methanol-benzene system, pls help.
Three-suffix Margules A 4594.025767J/mol 0J/mol B yl(cale) Y2(cale) P 1.245943306 0.677137488 105329.1702 106763.4369 107329.4344 1.186339269 1.159235455 1.129500170 1.115477296 1.086558251 1.066695118 1.044628016 2.389229152 1.026116306 107850.3744 Objective Function 15993362.44 29522236.30 35993212.91 42515281.76 45012750.29 48135002.22 47693313.25 42930115.54 0.771595325 0.823117972 0.888374138 0.923030581 1.005512140 1.074103858 1.168288932 0.126574033 1.272560466 108039.1542 108267.9393 108236.0346 107882.1077 76105.60348 107087.8998 636270179.6 33153409.55 Total 977218863.9 van Laar A 31429284.25J/mol 2760.273455J/mol B yi(calc) P y2(calc) 1.002566538 1.002523466 101426.2501 101413.1684 1.002350106 101401.9941 1.002117459 1.001849886 1.000028594 1.000019498 1.000015803 1.000012064 1.000010417 1.000007259 1.000005282 1.000003281 1.000603243 1.000001775 Objective Function 9264.080224 6916.986031 5183.150982 3465.306208 2378.737016 724.6599227 138.7846955 49.65352421 18912.62510 812.1910113 1.001164977 101388.8669 101378.7723 101356.9195 101341.7807 101322.9535 101192.4768 101301.5010 1.000568911 0.999553768 0.997895474 0.997730312 Total 47846.17472 Wilson , 0.599990639 J/mol 1.496430885 J/mol yi(cale) y2(cale) P 101350.2890 0.998987438 0.999145418 0.999232425 0.999340058 0.999395498 0.999520268 0.999614830 0.999729321 1.000559634 0.999834045 1.002328455 1.002021767 1.001826322 1.001553882 1.001398236 1.001001038 1.000644679 1.000120061 1.001733410 0.999492955 101336.6725 101330.4427 101323.7412 101320.6978 101314.8791 101311.5181 101308.9862 101472.8194 101308.8773 Objective Function 411.6439061 44.52267192 0.195985818 39.17247093 86.53132887 228.6406427 341.5806755 441.5783601 20397.37198 446.1703322 Total 22437.40836 (e) Compare the equilibrium vapour mole fraction predicted using the activity models in Part (1)(d) with the experimental data. Discuss the findings with the aid of y-x plot and comment on the suitability of using these models for this system. (13 marks) Three-suffix Margules A 4594.025767J/mol 0J/mol B yl(cale) Y2(cale) P 1.245943306 0.677137488 105329.1702 106763.4369 107329.4344 1.186339269 1.159235455 1.129500170 1.115477296 1.086558251 1.066695118 1.044628016 2.389229152 1.026116306 107850.3744 Objective Function 15993362.44 29522236.30 35993212.91 42515281.76 45012750.29 48135002.22 47693313.25 42930115.54 0.771595325 0.823117972 0.888374138 0.923030581 1.005512140 1.074103858 1.168288932 0.126574033 1.272560466 108039.1542 108267.9393 108236.0346 107882.1077 76105.60348 107087.8998 636270179.6 33153409.55 Total 977218863.9 van Laar A 31429284.25J/mol 2760.273455J/mol B yi(calc) P y2(calc) 1.002566538 1.002523466 101426.2501 101413.1684 1.002350106 101401.9941 1.002117459 1.001849886 1.000028594 1.000019498 1.000015803 1.000012064 1.000010417 1.000007259 1.000005282 1.000003281 1.000603243 1.000001775 Objective Function 9264.080224 6916.986031 5183.150982 3465.306208 2378.737016 724.6599227 138.7846955 49.65352421 18912.62510 812.1910113 1.001164977 101388.8669 101378.7723 101356.9195 101341.7807 101322.9535 101192.4768 101301.5010 1.000568911 0.999553768 0.997895474 0.997730312 Total 47846.17472 Wilson , 0.599990639 J/mol 1.496430885 J/mol yi(cale) y2(cale) P 101350.2890 0.998987438 0.999145418 0.999232425 0.999340058 0.999395498 0.999520268 0.999614830 0.999729321 1.000559634 0.999834045 1.002328455 1.002021767 1.001826322 1.001553882 1.001398236 1.001001038 1.000644679 1.000120061 1.001733410 0.999492955 101336.6725 101330.4427 101323.7412 101320.6978 101314.8791 101311.5181 101308.9862 101472.8194 101308.8773 Objective Function 411.6439061 44.52267192 0.195985818 39.17247093 86.53132887 228.6406427 341.5806755 441.5783601 20397.37198 446.1703322 Total 22437.40836 (e) Compare the equilibrium vapour mole fraction predicted using the activity models in Part (1)(d) with the experimental data. Discuss the findings with the aid of y-x plot and comment on the suitability of using these models for this system. (13 marks)Step by Step Solution
There are 3 Steps involved in it
Step: 1

Get Instant Access to Expert-Tailored Solutions
See step-by-step solutions with expert insights and AI powered tools for academic success
Step: 2

Step: 3

Ace Your Homework with AI
Get the answers you need in no time with our AI-driven, step-by-step assistance
Get Started


