Question
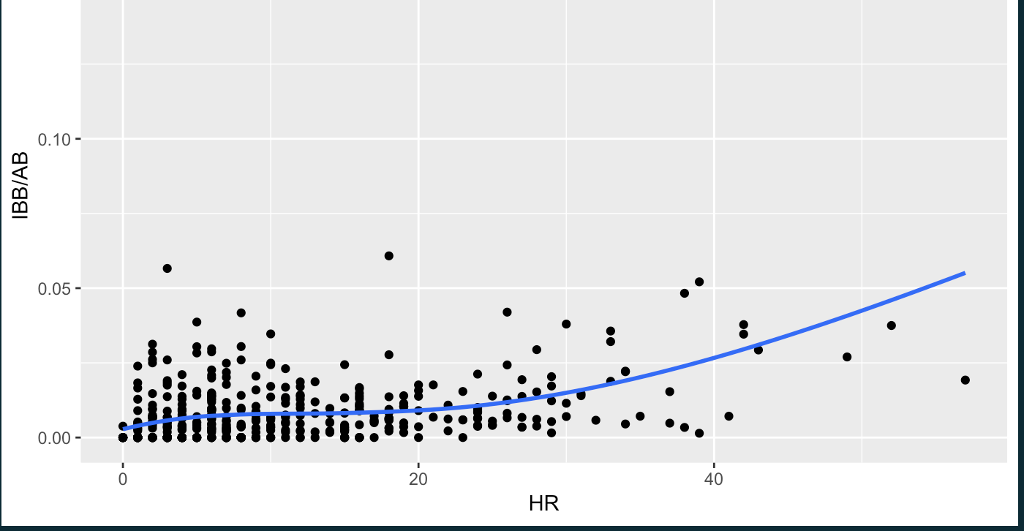
this is what I done so far and I need to do the last part which is ... *Identifies and labels the outlier in the

 this is what I done so far and I need to do the last part which is ...
*Identifies and labels the outlier in the data set in these variables (easily spotted once the scatter plot is drawn)*
*(Hint: `geom`-type functions can accept data arguments and will use the data set passed rather than the default for the chart. So for the third requirement, consider adding a text layer with `geom_text(data = ..., aes(...))` where the argument passed to `data` is a subset of the data set consisting of the outlier, and `aes(...)` defines how to label that outlier.)*
please help !!
0.10 0.05 0.00 40 20 HR 0.10 0.05 0.00 40 20 HR
Step by Step Solution
There are 3 Steps involved in it
Step: 1

Get Instant Access to Expert-Tailored Solutions
See step-by-step solutions with expert insights and AI powered tools for academic success
Step: 2

Step: 3

Ace Your Homework with AI
Get the answers you need in no time with our AI-driven, step-by-step assistance
Get Started


