Answered step by step
Verified Expert Solution
Link Copied!

Question

1 Approved Answer

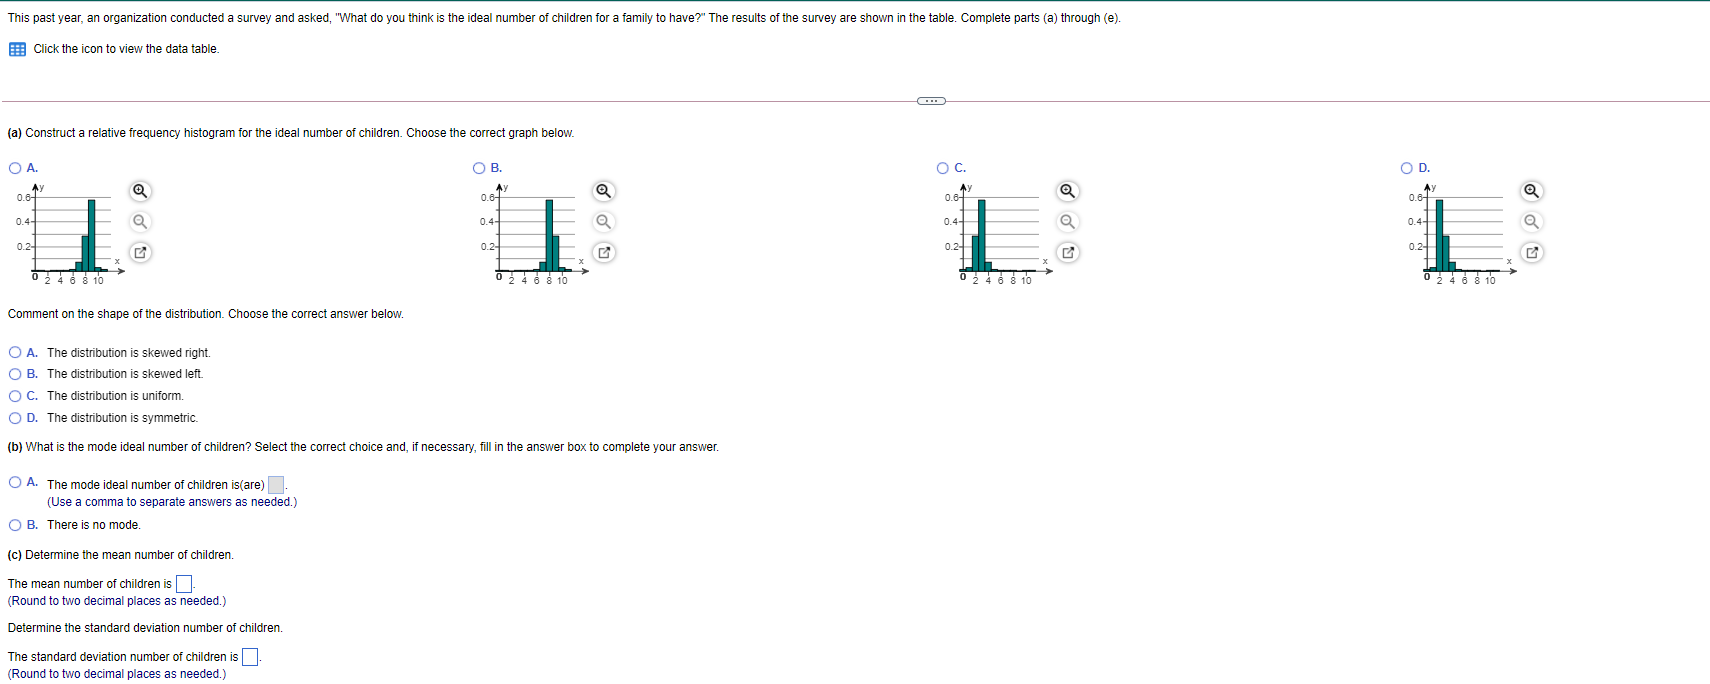
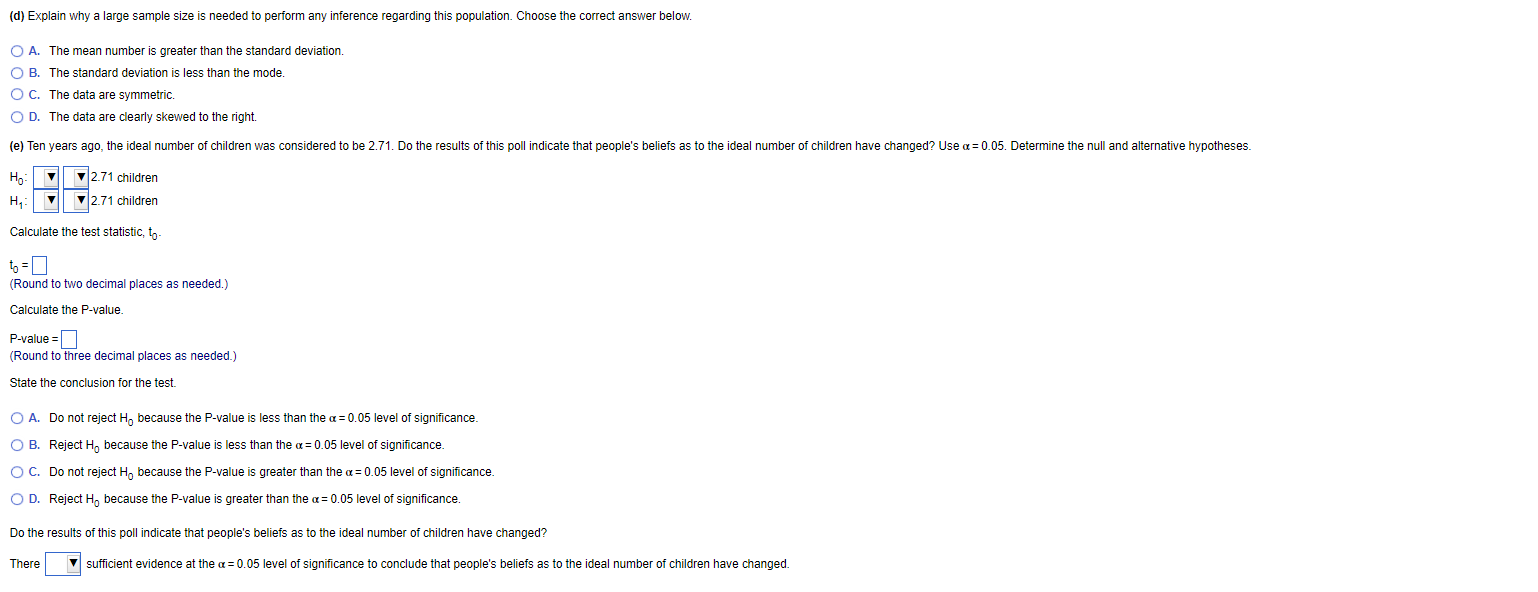
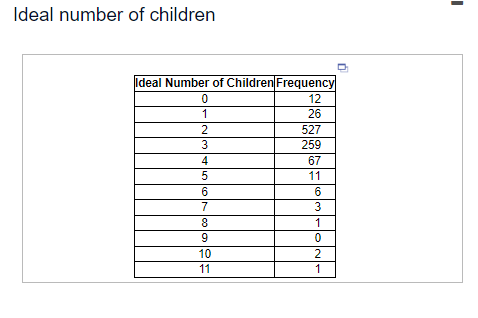
This past year, an organization conducted a survey and asked, What do you think is the ideal number of children for a family to have?

image text in transcribedimage text in transcribedimage text in transcribed
This past year, an organization conducted a survey and asked, "What do you think is the ideal number of children for a family to have?" The results of the survey are shown in the table. Complete parts (a) through (e). : Click the icon to view the data table. (a) Construct a relative frequency histogram for the ideal number of children. Choose the correct graph below. O A. OB O C. O D. 0.6- 0.67 0.67 0.67 0.4- 0.4- Q 0.4- 0.4- 0.2- 0.2- 0.2- 0.2- Q 4 6 8 10 0 2 4 6 8 10 0 2 4 6 8 10 0 2 4 6 8 10 Comment on the shape of the distribution. Choose the correct answer below. O A. The distribution is skewed right. O B. The distribution is skewed left. O C. The distribution is uniform. O D. The distribution is symmetric. (b) What is the mode ideal number of children? Select the correct choice and, if necessary, fill in the answer box to complete your answer. O A. The mode ideal number of children is(are). (Use a comma to separate answers as needed.) O B. There is no mode. (c) Determine the mean number of children. The mean number of children is (Round to two decimal places as needed.) Determine the standard deviation number of children. The standard deviation number of children is]. Round to two decimal places as needed.)(d) Explain why a large sample size is needed to perform any inference regarding this population. Choose the correct answer below. O A. The mean number is greater than the standard deviation. O B. The standard deviation is less than the mode. O C. The data are symmetric. O D. The data are clearly skewed to the right. (e) Ten years ago, the ideal number of children was considered to be 2.71. Do the results of this poll indicate that people's beliefs as to the ideal number of children have changed? Use a= 0.05. Determine the null and alternative hypotheses. Ho 2.71 children 2.71 children Calculate the test statistic, to to = 0 (Round to two decimal places as needed.) Calculate the P-value. P-value = (Round to three decimal places as needed.) State the conclusion for the test. O A. Do not reject Ho because the P-value is less than the a = 0.05 level of significance. O B. Reject Ho because the P-value is less than the a = 0.05 level of significance. O C. Do not reject Ho because the P-value is greater than the o= 0.05 level of significance. O D. Reject Ho because the P-value is greater than the a = 0.05 level of significance. Do the results of this poll indicate that people's beliefs as to the ideal number of children have changed? There |sufficient evidence at the a = 0.05 level of significance to conclude that people's beliefs as to the ideal number of children have changed.Ideal number of children Ideal Number of Children Frequency 12 26 2 527 259 67 11 6 3 O 10 11

Step by Step Solution

There are 3 Steps involved in it

Step: 1

blur-text-image

Get Instant Access to Expert-Tailored Solutions

See step-by-step solutions with expert insights and AI powered tools for academic success

Step: 2

blur-text-image

Step: 3

blur-text-image

Ace Your Homework with AI

Get the answers you need in no time with our AI-driven, step-by-step assistance

Get Started

Recommended Textbook for

A Preface To Logic

Authors: Morris R Cohen

1st Edition

0486801853, 9780486801858

More Books

Students also viewed these Mathematics questions

Question

2. To store it and

Answered: 1 week ago