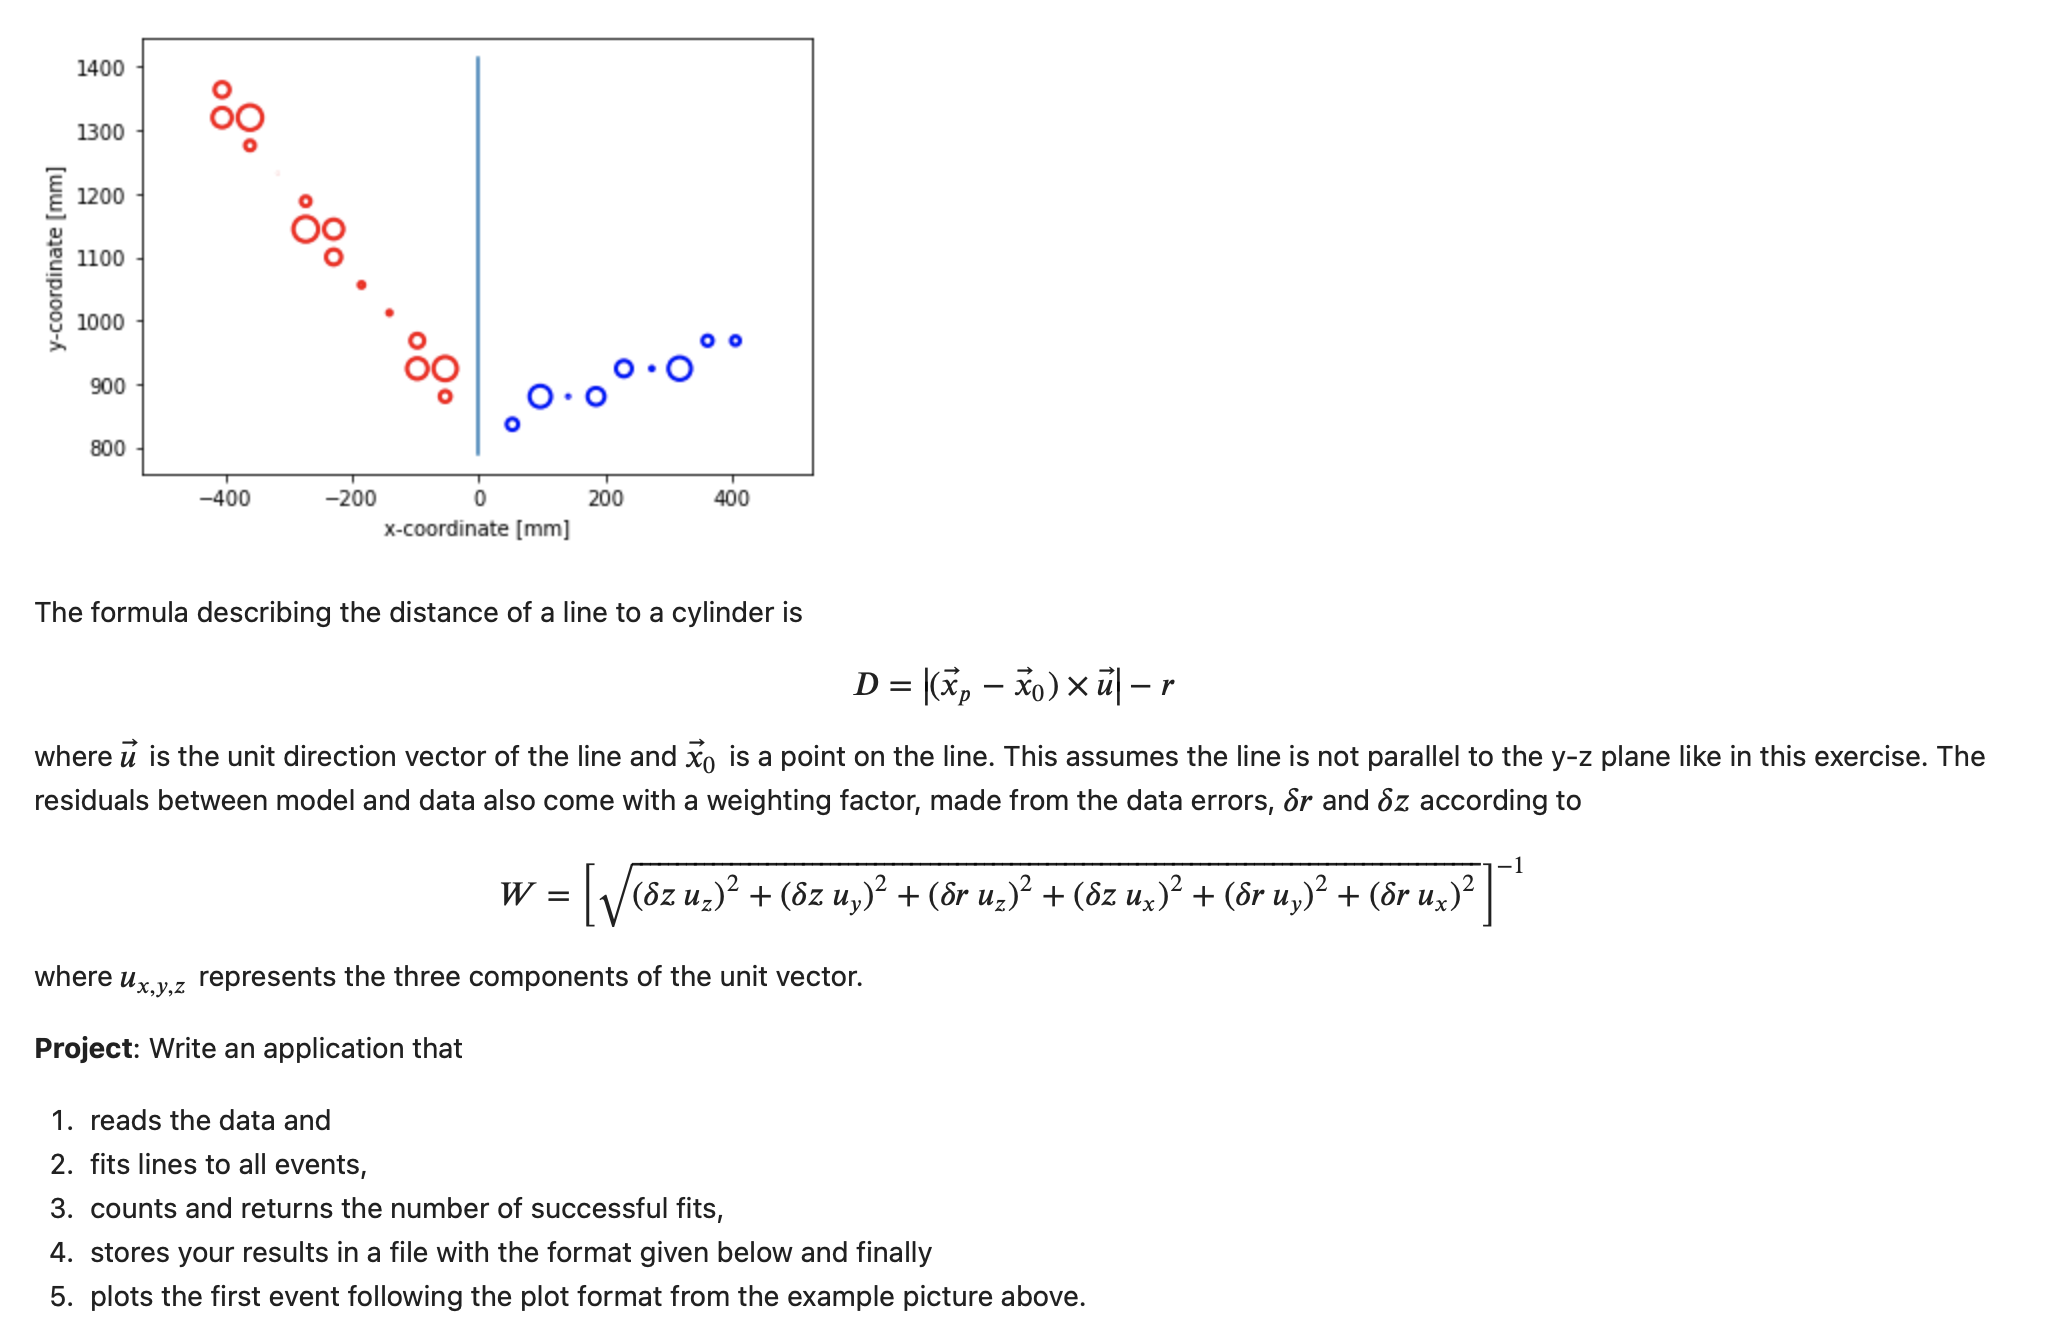
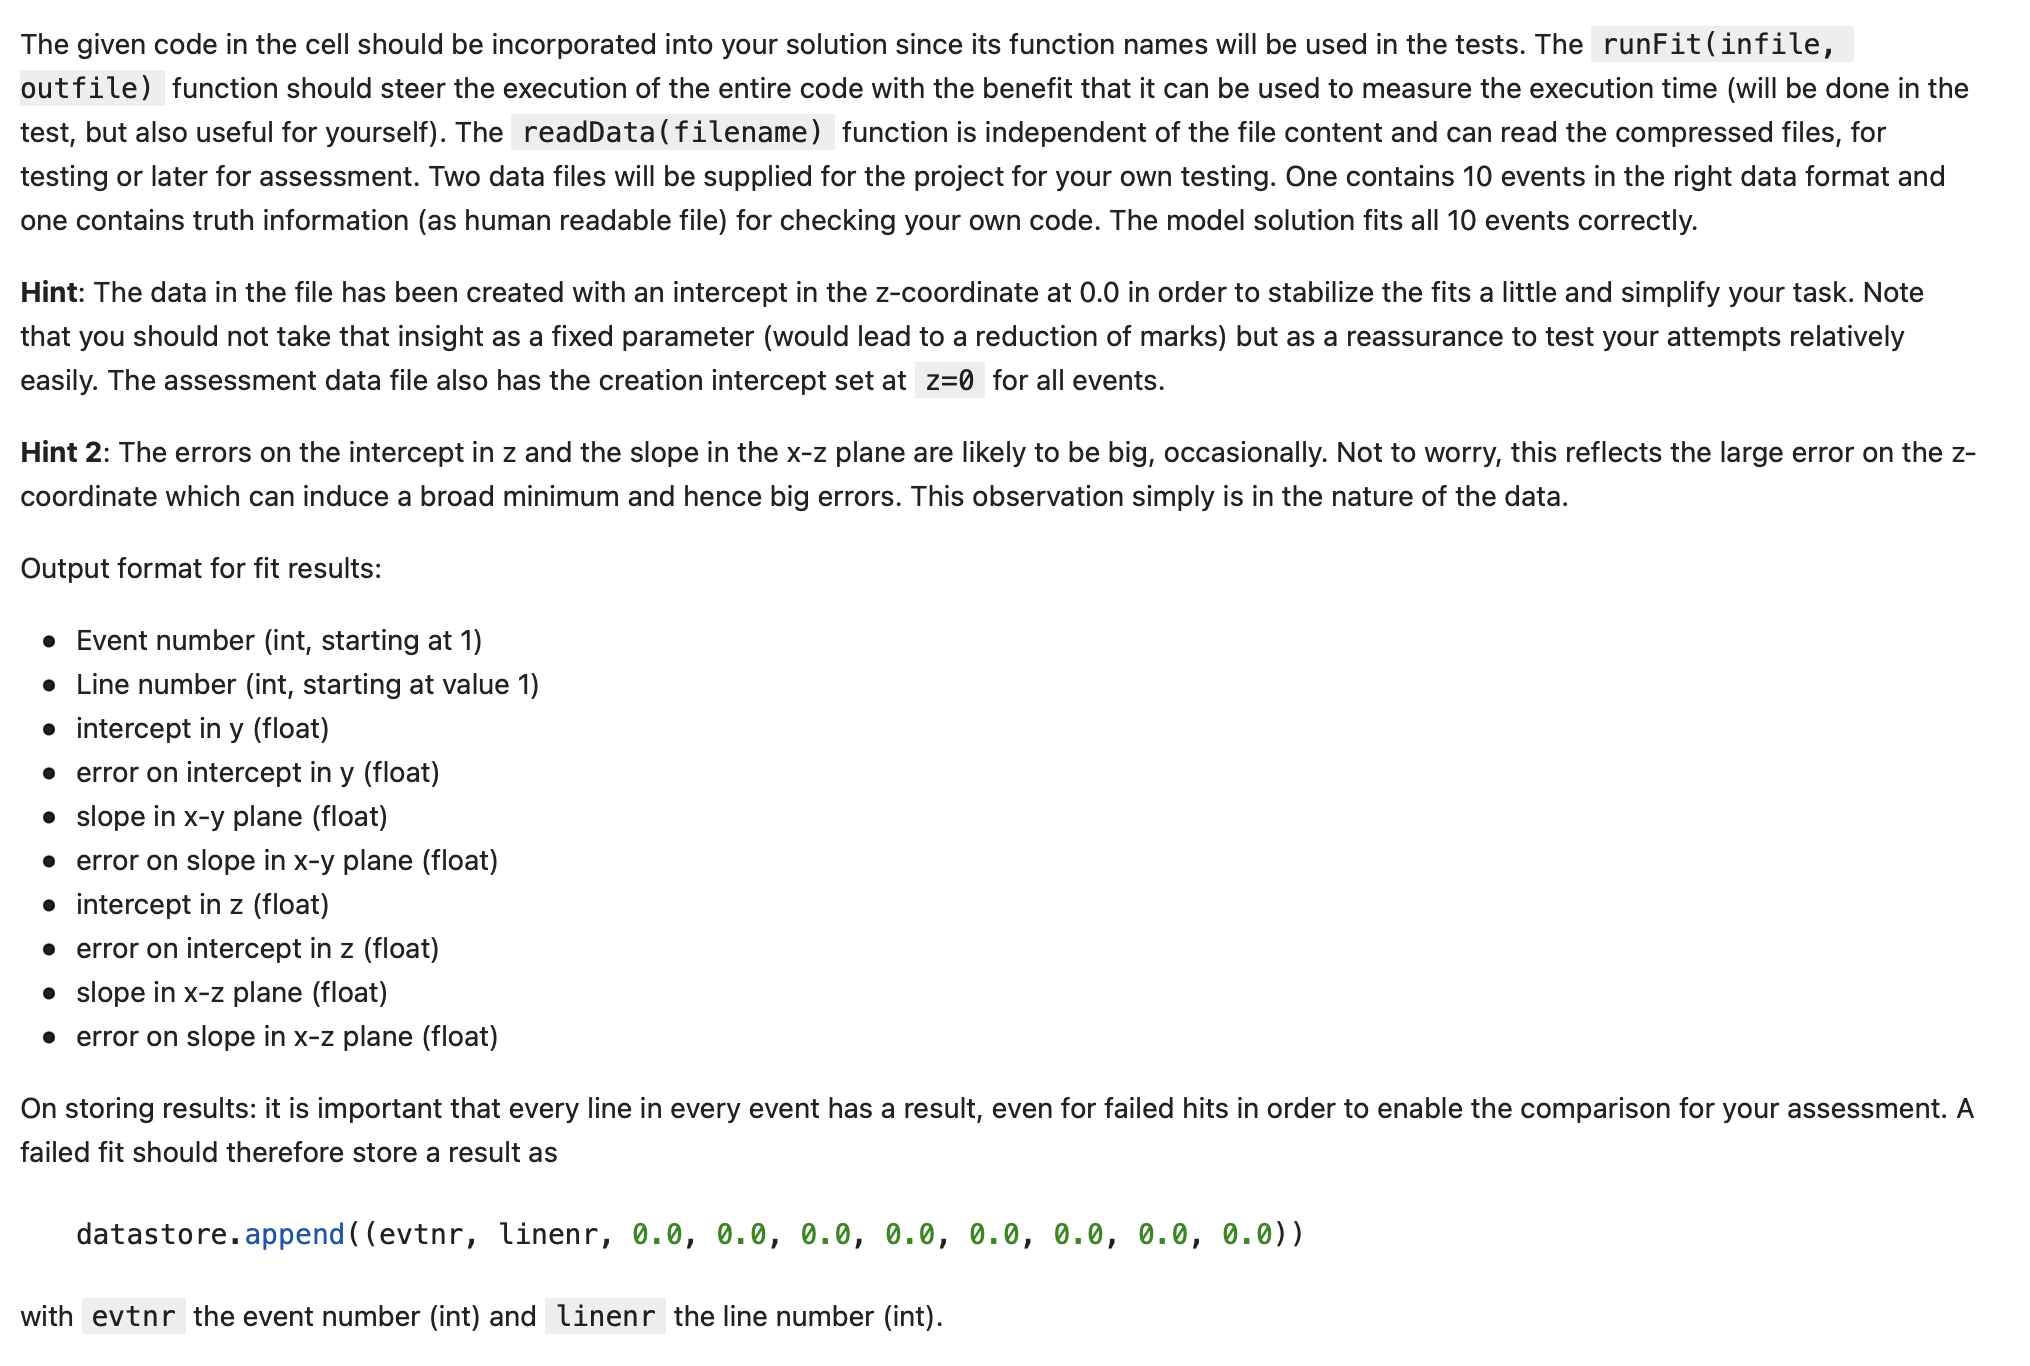
This project aims at fitting lines in 3D to data consisting of cylinders (produced by individual Geiger counters). Each cylinder is hence centred around an individual wire (parallel to the z-axis) on a regular grid and has a fixed radius. The cylinder height corresponds to a fixed z-coordinate error. The radius also has an error (at 10% of the radius value or at least 0.5mm ). You have access to a file containing 10 events. The format is defined below. Each event contains data corresponding to two lines. Each line originates from a simulated electron, each starting at the x=0 plane from the same point, one emitted to the left, i.e. negative x-coordinates, one to the right, with positive x-coordinates. Coordinates are given in millimetres. The file arrives in compressed form. You can read it as given using np. loadtxt(filename, delimiter=',') . The column entries (and type) are - Event number (int, starting at value 1) - Line number (int, starting at value 1) - Wire x-coordinate (float) - Wire y-coordinate (float) - Wire z-coordinate (float) - Radius (float) - Radius error (float) - Wire z-coordinate error (float) An example event is shown in the figure below. For your own figure, note that the matplotlib.pyplot library has a pyplot. Circle( (x, y ), radius, fill=False, lw=2 ) function that can be added as a 'patch' to a figure. The formula describing the distance of a line to a cylinder is D=(xpx0)ur where u is the unit direction vector of the line and x0 is a point on the line. This assumes the line is not parallel to the yz plane like in this exercise. The residuals between model and data also come with a weighting factor, made from the data errors, r and z according to W=[(zuz)2+(zuy)2+(ruz)2+(zux)2+(ruy)2+(rux)2]1 where ux,y,z represents the three components of the unit vector. Project: Write an application that 1. reads the data and 2. fits lines to all events, 3. counts and returns the number of successful fits, 4. stores your results in a file with the format given below and finally 5. plots the first event following the plot format from the example picture above. The given code in the cell should be incorporated into your solution since its function names will be used in the tests. The runFit (infile, outfile) function should steer the execution of the entire code with the benefit that it can be used to measure the execution time (will be done in the test, but also useful for yourself). The readData(filename) function is independent of the file content and can read the compressed files, for testing or later for assessment. Two data files will be supplied for the project for your own testing. One contains 10 events in the right data format and one contains truth information (as human readable file) for checking your own code. The model solution fits all 10 events correctly. Hint: The data in the file has been created with an intercept in the z-coordinate at 0.0 in order to stabilize the fits a little and simplify your task. Note that you should not take that insight as a fixed parameter (would lead to a reduction of marks) but as a reassurance to test your attempts relatively easily. The assessment data file also has the creation intercept set at z=0 for all events. Hint 2: The errors on the intercept in z and the slope in the xz plane are likely to be big, occasionally. Not to worry, this reflects the large error on the coordinate which can induce a broad minimum and hence big errors. This observation simply is in the nature of the data. Output format for fit results: - Event number (int, starting at 1) - Line number (int, starting at value 1) - intercept in y (float) - error on intercept in y (float) - slope in xy plane (float) - error on slope in xy plane (float) - intercept in z (float) - error on intercept in z (float) - slope in xz plane (float) - error on slope in xz plane (float) On storing results: it is important that every line in every event has a result, even for failed hits in order to enable the comparison for your assessment. A failed fit should therefore store a result as datastore. append ( (evtnr, linenr, 0.0,0.0,0.0,0.0,0.0,0.0,0.0,0.0)) with the event number (int) and the line number (int)