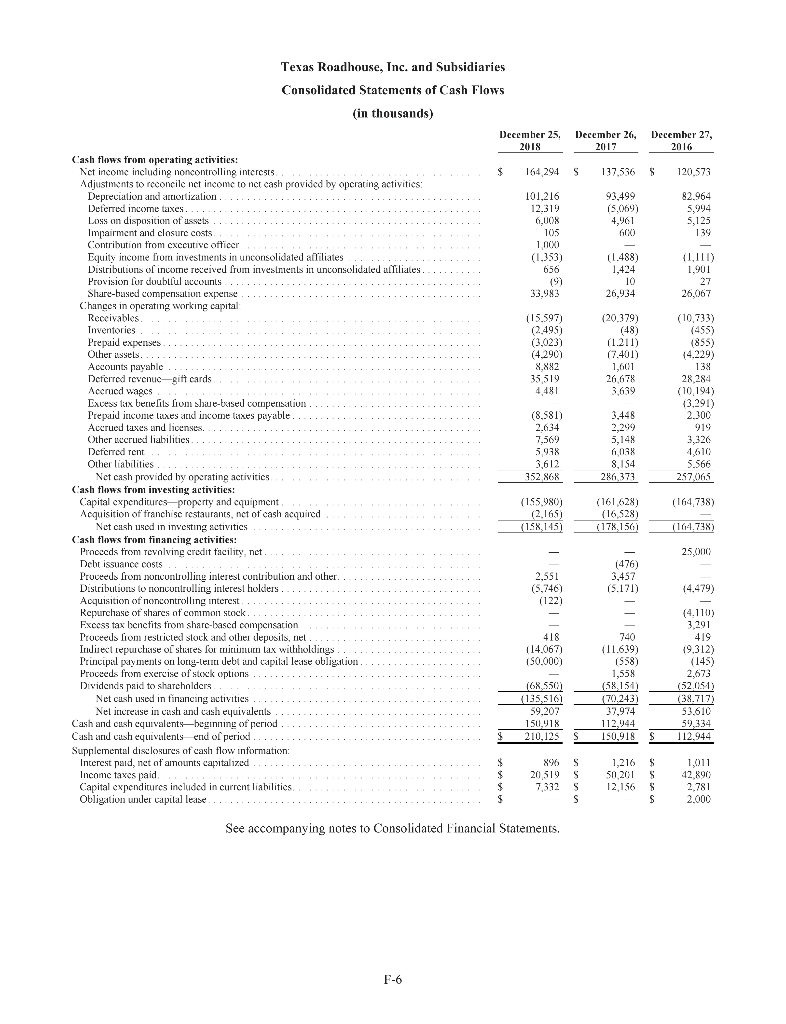
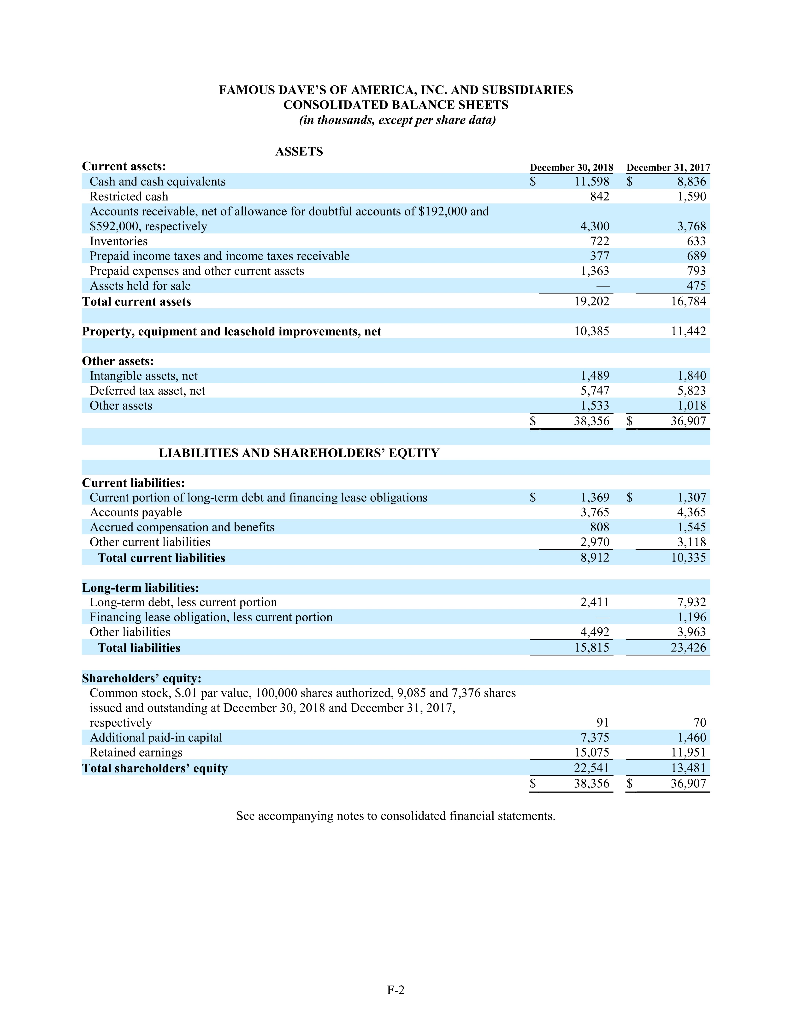
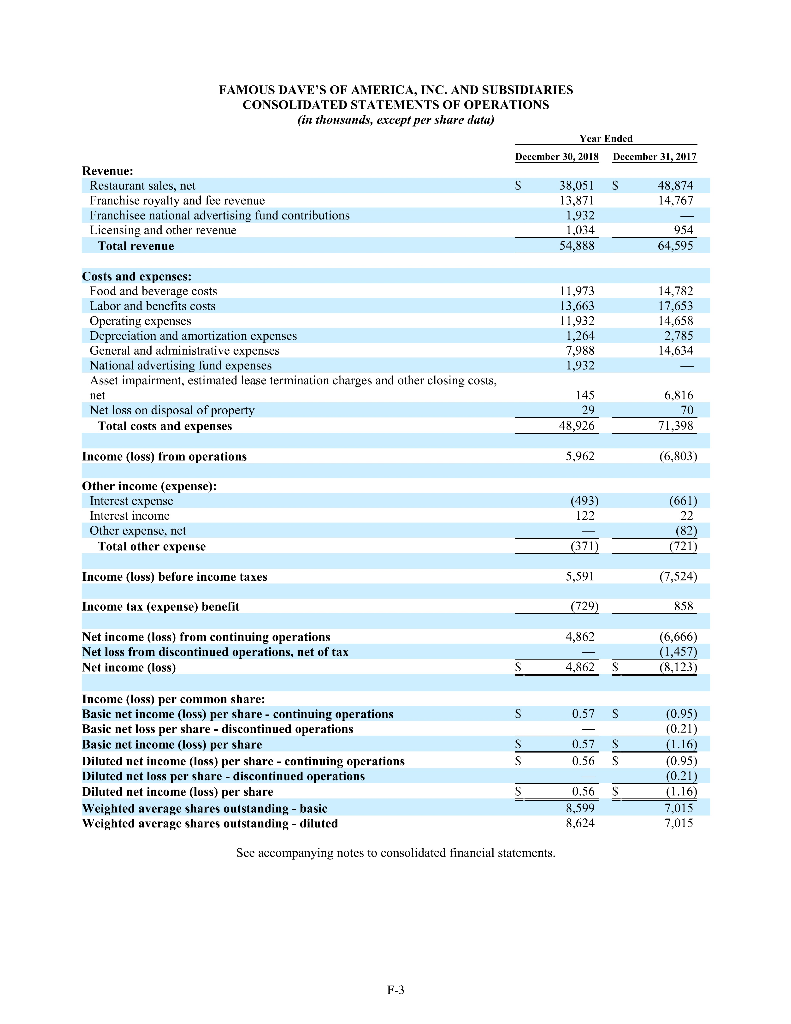
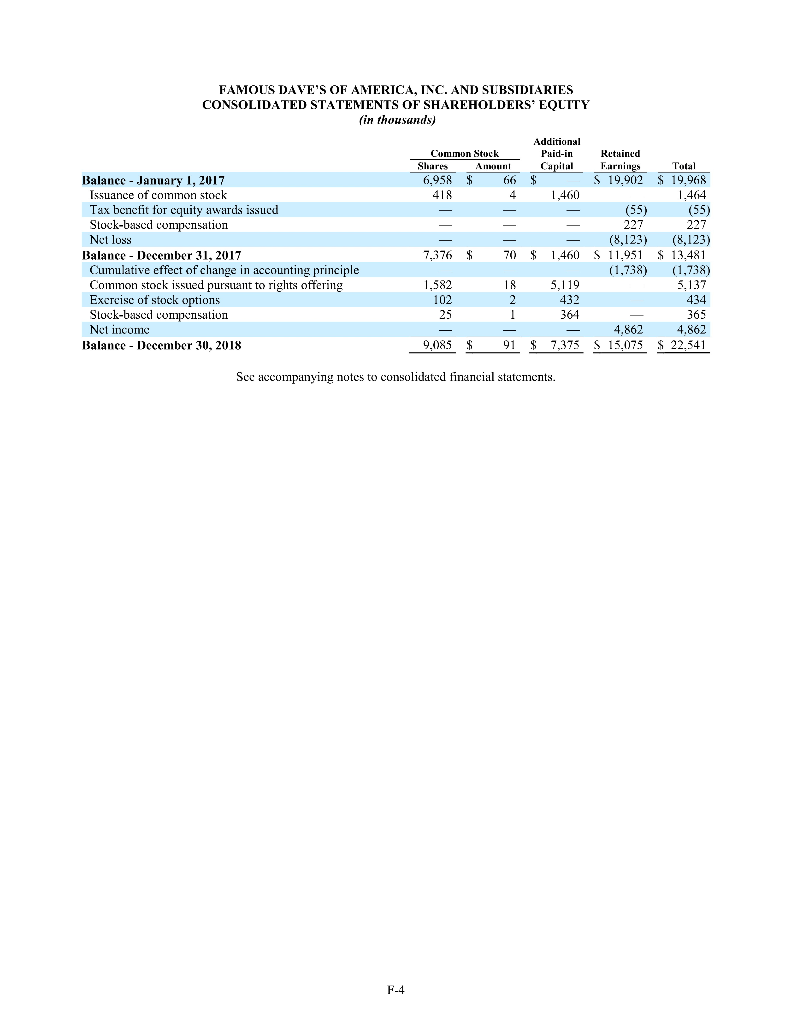
This project will involve accessing information from the internet, computing ratios
and analyzing information. You will be using recent the following
Annual
Reports
for Famous Daves and Texas Roadhouse to answer the following
questions. Both companies annual reports are
for 2018 and are located in Content. All answers must be typed. You can use
this document or a word document with the answers only. SHOW ALL WORK
FOR PARTIAL CREDIT! Famous Dave will be comparing fiscal years ending
12/30/18 and 12/31/17. Texas Roadhouse will be comparing fiscal years ending
12/25/18 and 12/26/17
.
Please read the entire report but print only what you will need. I suggest
printing the four financial statements at a minimum. Be sure to locate the full
financial reports and not selected financial information.
SHOW ALL
CALCULATIONS AND ROUND ALL ANSWERS TO TWO PLACES AFTER THE
DECIMAL POINT.
If you do not show your work you will not receive full credit. I
will take off points if you do not round correctly. SHOW ALL WORK AND
CALCULATIONS
Please use correct spelling and grammar in all answers. The end product should
be something you would give to your supervisor at work. REMEMBER. NO
HANDWRITTEN ANSWERS ACCEPTED. SHOW ALL WORK FOR PARTIAL
CREDIT
1.
Calculate the current ratio for Famous Daves the current and past year
(5pts.)
2.
Calculate the current ratio for Texas Roadhouse the current and past year
(5 pts.)
3.
Describe in two complete sentences what the current ratio measures
(3 pts)
4.
Which company has a better current ratio and why? TWO COMPLETE
SENTENCES REQUIRED (3 pts.)
5.
Calculate the accounts receivable turnover ratio for Famous Daves (4
pts.) ASSUME ALL SALES OR REVENUES ON THE INCOME
STATEMENT ARE CREDIT SALES
6.
Calculate the accounts receivable turnover ratio for Texas Roadhouse
(4pts.) ASSUME ALL SALES OR REVENUES ON THE INCOME
STATEMENT ARE CREDIT SALES.
7.
Describe in two complete sentences what the receivable turnover ratio
measures. (3 pts)
8.
Which company has a better receivable turnover ratio? (1 pts) Why? (3
pts.) THREE COMPLETE SENTENCES REQUIRED
9.
Calculate the number of days sales in receivables for each company. 4
(pts)
10.
Calculate the inventory turnover ratio for Famous Daves (5pts.)
11.
Calculate the inventory turnover ratio for Texas Roadhouse (5 pts.)
12.
Describe in two complete sentences what the inventory turnover ratio
measures. (3 pts)
13.
Which company has a better inventory turnover ratio? (1 pt) Why? (3
pts) THREE COMPLETE SENTENCES REQUIRED
14.
Calculate the number of days sales in inventory for each company.
(4pts)
15.
Calculate the debt to equity ratio for Famous Daves for the current and
prior year
(5 pts.)
16.
Calculate the debt to equity ratio for Texas Roadhouse for the current
and prior year. (5 pts)
17.
Describe in three complete sentences what the debt to equity ratio
measures and why this would be important to a potential creditor. (4 pts)
18.
Calculate the profit margin ratio for Famous Daves for the current and
prior year (5 pts)
19.
Calculate the profit margin ratio for Texas Roadhouse for the current and
prior year (5 pts.)
20.
Describe in two complete sentences what the profit margin ratio
measures. (4 pts)
21.
Which company has a better profit margin ratio? (1 pts). Why is this
important to you? (Three complete sentences are required) (3pts)
22.
How did the Famous Daves management describe the current year as
compared to prior years? What are their plans for the future? THREE
FULL PARAGRAPHS REQUIRED (5 pts.) The answer must be typed and
in your own words. If you copy it directly from the annual report, you will
receive zero points
23.
How did the Texas Roadhouse management describe the current year as
compared to prior years? What are their plans for the future? THREE
FULL PARAGRAPHS REQUIRED (5 pts.) The answer must be typed and
in your own words. If you copy it directly from the annual report, you will
receive zero points
24.
Who audited Famous Daves? Who audited Texas Roadhouse? (2pts)
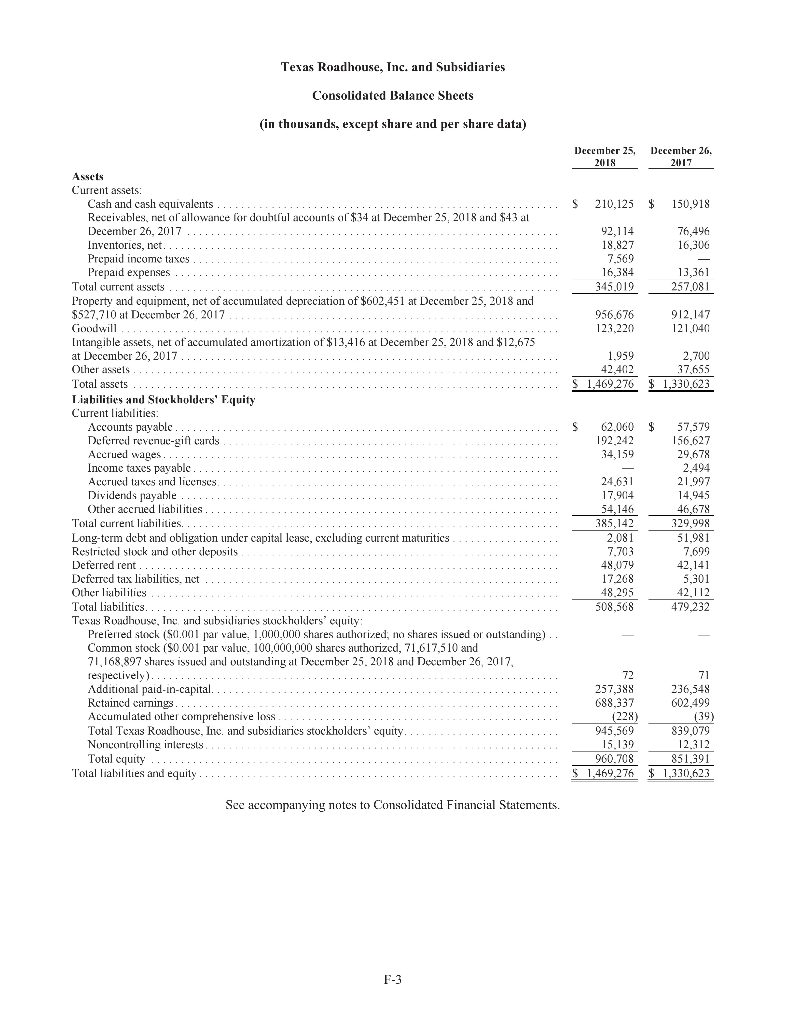
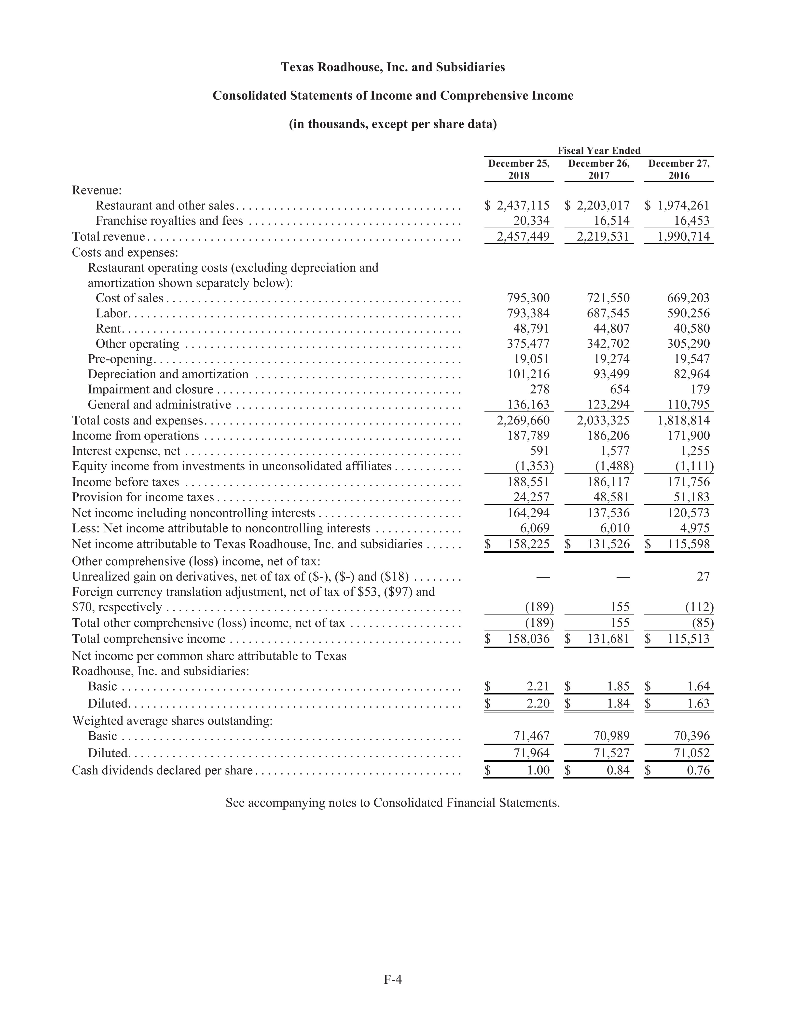
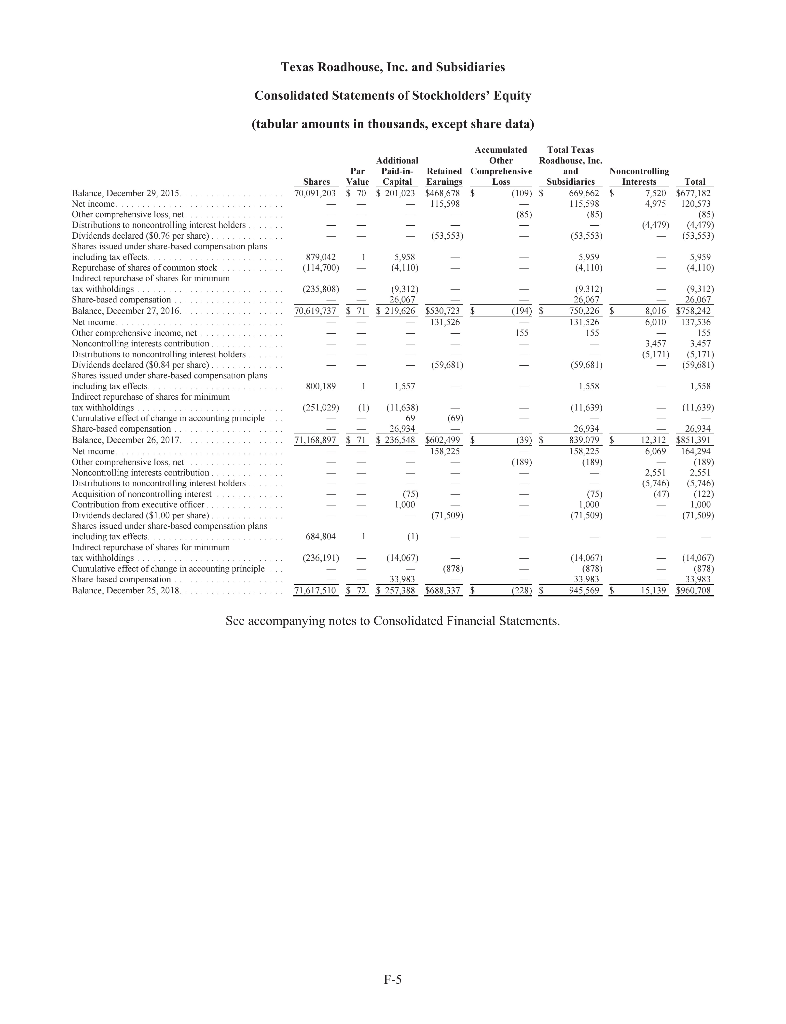
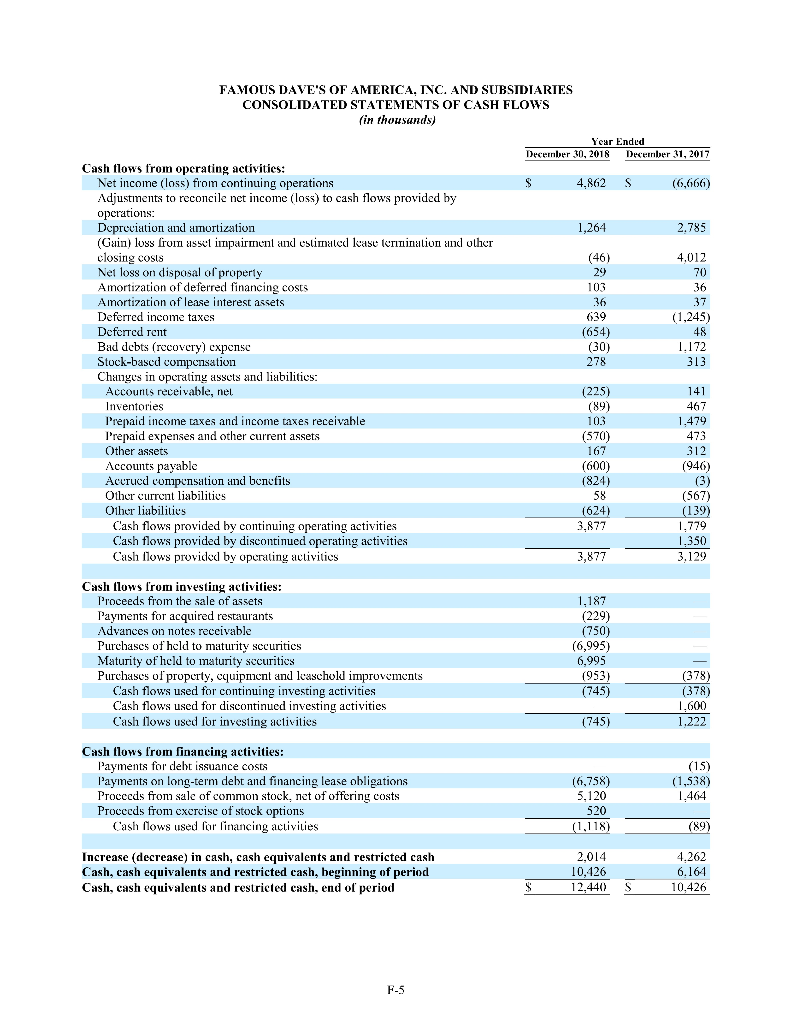
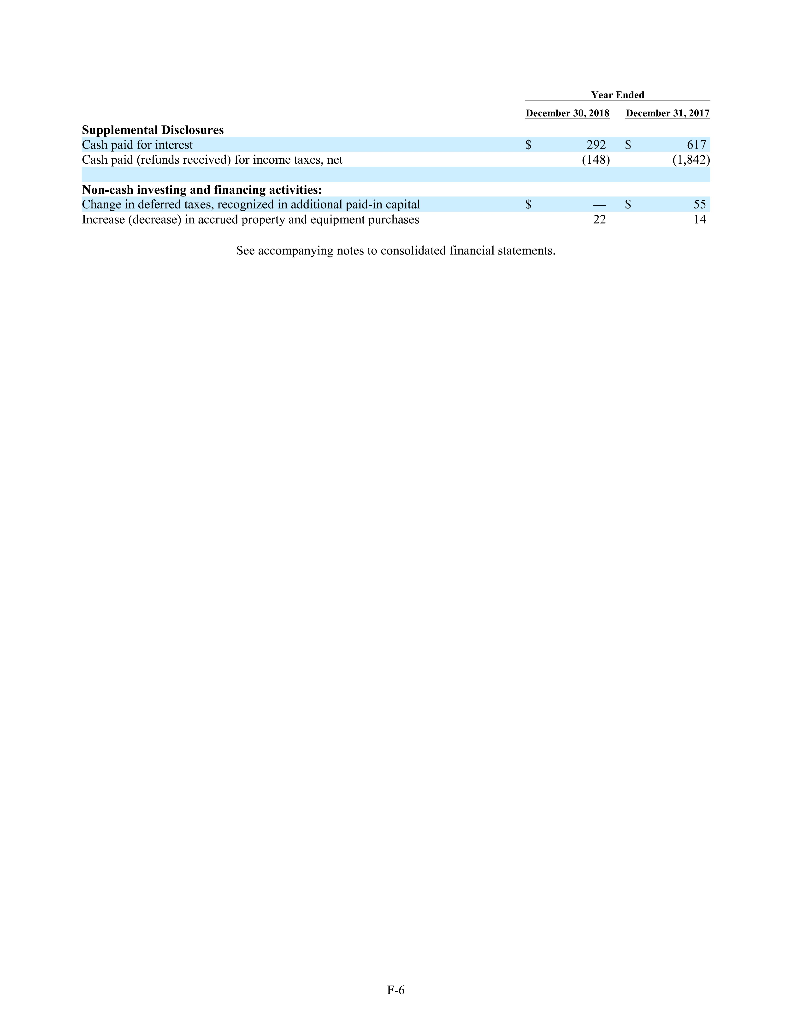
Texas Roadhouse, Inc. and Subsidiaries Consolidated Balance Sheets (in thousands, except share and per share data) December 25, 2018 December 26. 2017 $ 210,125 $ 150,918 76,496 16,306 92,114 18.827 7,569 16,384 345,019 13,361 257,081 956,676 123,220 912,147 121,040 1,959 42,402 S 1,469 276 2,700 37.655 $ 1,330,623 S $ 62,060 192.242 34.159 Assets Current assets: Cash and cash equivalents .. ... Receivables, net al allowance for doubtful accounts of $34 al December 25, 2018 and $43 al December 26, 2017 .. Inventories, net.. Prepaid income taxes... Prepaid expenses ........... .... Total current assets ........... Property and equipment, net of accumulated depreciation of $602,451 at December 25, 2018 and $527,710 at December 26, 2017.... Goodwill Intangible assets, net of accumulated amortization of $13,416 at December 25, 2018 and $12,675 at December 26, 2017 .... Other assets... Total assets .............. Liabilities and Stockholders' Equity Current liabilities: Accounts payable... Deferred revenuc-gift cards..... Accrued wages.. Income taxes payable.... Accrued taxes and licenses........ Dividends payable ......... .. Other accrued liabilities .... Total current liabilities. .. Long-term debt and obligation under capital lcasc, cxcluding current maturities... Restricted stuck and other leposits Deterred rent.... Deferred tax liabilitics, ict. Other liabilities ......... . Total liabilitics. ............. . Texus Roadhouse, Inc and subsidiaries stockholders' equily: Prelerred stock (S0.001 par value, 1,000,000 shares authorized, no shares issued or outstanding). Common stock (S0.001 par valuc. 100,000,000 sharcs authorized, 71,617,510 and 71,168,897 shares issued and outstanding at December 25, 2018 and December 26, 2017, respectively). .............. . Additional paid-in-capital. ........ Retained camnings... Accumulated other comprehensive loss...... Total Texas Roadhouse, Inc. and subsidiaries stockholders' equity... Nuncontrolling interests Total cquity ....... . Total liabilities and equity. 24.631 17.904 54,146 385,142 2,081 7.703 48,079 17.268 48.295 508,568 57,579 156.627 29,678 2,494 21.997 14,945 46,678 329,998 51,981 7,699 42,141 5,301 42,112 479,232 72 257,388 688,337 (228) 945,569 15.139 960.708 $ 1,469,276 71 236,548 602,499 (39) 839,079 12.312 851,391 $ 1,330,623 See accompanying notes to Consolidated Financial Statements, F-3 Texas Roadhouse, Inc. and Subsidiaries Consolidated Statements of Income and Comprehensive Income (in thousands, except per share data) December 25, 2018 Fiscal Year Ended December 26, 2017 December 27, 2016 $ 2,437,115 20.334 2.457.449 $ 2,203.017 16.514 2.219.531 $ 1.974.261 16,453 1.990,714 795,300 793,384 48.791 375.477 19.051 101,216 278 Revenue: Restaurant and other sales.. Franchise royalties and fees ........ Total revenue........ ......... Costs and expenses: Restaurant operating costs (excluding depreciation and antortization shown separately below): Cost of sales ........... Labor................... Rent.... . .. ..... .. .. . Other operating .................... Pre-opening...... Depreciation and amortization .. Impairment and closure. General and administrative.... Total costs and expenses..... Income from operations ........... Interest expensc, net ........ Fquity income from investments in unconsolidated affiliates......... Income before taxes .............. Provision for income taxes....................................... Nct income including noncontrolling interests ...... Less: Vet income attributable to noncontrolling interests ......... Net income attributable to Texas Roadhouse, Inc. and subsidiaries..... Other comprehensive (loss) income, net of tax: Unrealized gain on derivatives, net of tax of (S-,($-) and (S18)... Foreign currency translation adjustment, nct of lux of $53, ($97) and $70, respectively ........ Total other comprehensive (loss) inconic, net of tax .......... Tolal comprehensive income .... Nct income per common share attributable to Texas Roadhouse, Inc. and subsidiaries: Basic, .............. Diluted................... Weighted average shares outstanding: Basic ...................................................... D iluted............................................... ..... Cash dividends declared per share................................ 136,163 2,269,660 187.789 591 (1,353) 188.551 24.257 104.294 6.069 721,550 687,545 44.807 342.702 19.274 93,499 654 123.294 2,033,325 186.206 1.577 (1,488) 186,117 48,581 137,536 6,010 669,203 590.256 40.580 305,290 19,547 82,964 179 110.795 1.818.814 171.900 1,255 (1,111) 171,756 51,183 120,573 4,975 (189) (189) 158.036 (112) (85) 115,513 $ 155 131.681 $ $ $ $ 2.21 2.20 $ $ 1.85 1.84 $ $ 1.64 1.63 71,467 71.964 1.00 70.989 71,527 0.84 70,396 71,052 0.76 $ $ See accompanying notes lo Consolidated Financial Statements. Texas Roadhouse, Inc. and Subsidiaries Consolidated Statements of Stockholders' Equity (tabular amounts in thousands, except share data) o Par Sbarcs Value 7 (191,2017 $ 70 191,2" ncontrolling Interests 7.521 4,975 Accumulated Total Texas Additional Other Rondbouse, Inc. Paid in Keluineel Cupiruliensive am Capital Earnings Loss Subsidiaries $ 211 21 1401 678 109) S 669 162 - 1.5,598 115,598 (85) - i53.353) (52,5531 3,95% S.959 14,110) 14,1101 Total 677.182 20.373 189) (1.1291 (53,553) - 11 - 5459 8790421 (1.4,700) (4.110) 19.2121 70.619,737 $ $ 219,626 $S30,723 1:31,526 19.2121 26.107 50.226 131.926 ISS 8,016 6,010 (9,312) 26.067 $758.242 177,516 135 3.457 (5,171) 159,681) 3,457 15,171) - 139,631) (59.6811 1.55 Ilala , December 29 2015 Nct income....... . . . . . .. Other Cinsehensive is nei Distributions la a lalling interest helders .. .. Dividends docloud (30.76 per share)...... Shures issued under stre-hased ecimension plans including las elect .. .. .. Recurchase of shares of common stock .. .. .. .. Indirect repurchase plures furninum tax withholding... .. .. .. . .. .. .. Share-based compensation .. . .. Balancc, December 27, 2016. ................. Neleine Other comprehensive amic, net ... . .. .. Noncontroll pinterests contribution . 1 stihu nuncxin ing interest helters Dividends doeld (0.81 per shaic).. . .. .. .. Shares issued under strehus campensation plans including lar ellers Indicoot sourchoso of shace for ni Cox withholdings .. .. .. . .. .. .. C'urulative le a rnt un cuple . Share-based compensation.. .. .. .. Balacc. Iecember 26, 2017... .. . . .. Nel cine Cher Coin:rehensive loss. nel .. Norcontrollre interests contribution . .. .. Discuting t exniline interest belters . Acquisition of controlling interest Contribution from executive otfioer. . .. D vitends declared ($1.00 per shure) Shares issued under sliarc-based m ens plans includinius eflects Indirect repurchaeol'sures ir minum tax withholdings Culative cffect of cuange in accounting principle .. Share le salon.. . . . Palace, December 25, 2018... .. 1,538 1,55 251.029) (1) (11,639) - 111639) (11.658) 36,934 $236,518 1697 71,168,897 - $ 71 $12,199 153 225 139) S $ 26,934 $39.079 158 225 (189 12,312 5,09 (189) 26.934 851,391 154,294 (189) 2.551 (5,745) (122) 1.000 171.509) 2,55L 15.746) | | (251 1,000 (251 (7151191 1,000 171509) 681.804 i co - (878) | 18781 (236,191) - (14,0671 - 31 URT 71,017.510 372. 3 257,388 114,067) (378) 13 483 5960208 88,387 123) S 345,569 15,139 See accompanying notes to Consolidated Financial Statements. F-S December 27, 2016 S 120.573 82.964 5,994 5,125 139 (111) 1,901 27 26,067 (10,733) (455) (855) 14.229) 138 28,284 (10,194) 13,291) 2.300 919 Texas Roadhouse, Inc. and Subsidiaries Consolidated Statements of Cash Flows (in thousands) December 25, December 26, 2018 2017 Cash flows from operating activities: Net income including noncontrolling interests $ 164 294 S 137,536 Adjustments to reconcile net income to nct cash provided by operating activities: Depreciation and accortization. ... . 101,216 93,499 Detered income taxes......... 12.319 (5.069) Loss on disposition of sets ........ 6,008 4,961 Impairment and closure costs 105 Contribution from cxccutive officer 100) Equity income from investiments in unconsolidated alliliates (1.353) 11.488) Distributions of income received from investments in unconsolidaled alTiliales 656 1,424 Provision Cur duubliul Lccounts .............. .. (9) 10 !! Share-based compensation expense 33.983 26,934 Chances in operating working capital Receivables.. 115.597) (20 379) Inventories. . . (2.495) (48) Prepaid expenses..... . (3,023) (1.211) Other ussels. ... (4.290) (7.401) Accounts payable ........ 8,882 1,601 Deferred revenue gift cards, 35,519 26678 Accrued wages 4,481 3.639 Excess lax benefits from share-bxseu compensation... Prepaid income lixes and income litxes payable.... (8,581) 3.448 Accrued taxes and licenses... 2.634 2,299 Other uccrued liabilities...... ......... 7,569 5,148 Deterred rent 5.938 11,038 Other liabilities 3,612 8,154 Net cash provided by operating activities 152 868 286,373 Cash flows from investing activities: Capital expenditures property and equipment (155.980) (161628) Acquisition of franchise restaurants, net of cash acquired (2.165) (16,528) Net cash used in investing activities ... (158,145) (178,1561 Cash flows from financing activities: Proceeds from revolving credit facility, net................ Debt issuance costs.. (476) Proceeds from Norcontrolling interest contribution and other... 2,551 3.457 Distributions to Troncotrolling in leresi holders ... (5,746) (5.171) Acquisition of noncontrolling interest ......... .... (1221 Rcyurchase of shares of conmon stack. ........ Excess tax bcncfits from share-based compensation Proceeds Lomjesticles stock and other deposits, riel. 418 740 Indirect repucase of stuces for colliu lax withholdings.. 114.067) (11.639) Principal payments on long-lente debt and capital lese obligation.. 150.000) (558) Proceeds from exercise of stock options ......... 1,558 Dividends paid to shareholders...... 168,550) (58,154) Net cush Lised in financing activities ....... (135,5161 (70.243) Nel increase in cast and cash equivalents ... 59,207 37,974 Cash and cush equivalent:beginning of period ... 150,918 112,044 Cash and cash equivalents end of period .......... $ 210,125 190,918 Supplemental disclosures of cash flow information: Interest raid, net of amounts capitalized ........... 89S 1,216 Income taxes paid $ 20,519 S 50 201 Capital expenditures included in current liabilitics $ 7,332 S 12,156 Obligation under capital lease........ 5.566 257,065 (1 64 738) (104.738) 25,000 14,479) (4.110) 3.291 419 19,312) (145) 2,673 (52.0451) (38.717) 53.610 50 334 112,944 $ $ S $ 1,011 42.890 2.781 2.000 See accompanying notes to Consolidated Financial Statements, F-6 FAMOUS DAVE'S OF AMERICA, INC. AND SUBSIDIARIES CONSOLIDATED BALANCE SHEETS (in thousands, except per share data) December 30, 2018 December 31, 2017 S 11.598 $ 8.836 842 1,590) ASSETS Current assets: Cash and cash cquivalents Restricted cash Accounts receivable, net of allowance for doubtful accounts of $192,000) and $592.001), l'espectively Inventories Prepaid income taxes and income taxes receivable Prepaid cxpenses and other current assets Assets held for sale Total current assets 4,300 722 377 1,363 3,768 633 689 793 475 16,784 19,202 Property, equipment and leasehold improvements, net 10,385 11.442 Other assets: Intangible assets, net Deferred lax asset, Other assets 1,489 5,747 1,533 38,356 1.840 5.823 1.018 36,907 S $ LIABILITIES AND SHAREHOLDERS' EQUITY S $ Current liabilities: Current portion of long-term debl and financing lease obligations Accounts payable Accried compensation and benefits Other current liabilities Total current liabilities 1,369 3.765 X08 2,970 8,912 1.307 4,365 1.545 3.118 10.335 2,411 Long-term liabilities: Long-term debt, less current portion Financing lease obligation, less current portion Other liabilities Total liabilities 4,492 15.815 7.932 1.196 3.963 23.426 Shareholders' cquity: Common stock, S.Ol par value, 100.000 sharcs authorized. 9.085 and 7,376 shares issued and outstanding at December 30, 2018 and December 31, 2017, respectively Additional paid-in capital Retained earnings Total shareholders' equity 70 1.460 91 7.375 15.075 22,541 38.356 11,951 13.481 36,907 S $ Sec accompanying notes to consolidated financial statements. F-2 FAMOUS DAVE'S OF AMERICA, INC. AND SUBSIDIARIES CONSOLIDATED STATEMENTS OF OPERATIONS (in thousands, except per share datu) Year Ended December 30, 2018 December 31, 2017 S S 48.874 14.767 Revenue: Restaurant sales, nel Franchise royally and lee revenue Franchisee national advertising fund contributions Licensing and other revenue Total revenue 38,051 13,871 1,932 1.034 54,888 954 64,595 Costs and expenses: Food and beverage costs Labor and benefits costs Operating expenses Depreciation and amortization expenses General and acininistrative expenses National advertising lund expenses Asset impairment, estimated lease lerinination charges and other closing costs, 11,973 13,663 11,932 1,264 7,988 1,932 14,782 17,653 14,658 2,785 14.634 net Net loss on disposal of property Total costs and expenses 145 29 48,926 6,816 70 71,398 Income (loss) froin operations 5,962 (6,803) Other income (expense): Interest expense Interest incoinc Other expense, nct Total other expense (493) 122 (661) (82) (721) (371) Income (Loss) before income taxes 5,591 (7,524) Income tax (expense) bepelit (729) 858 Net income (Loss) from continuing operations Net loss from discontinued operations, net of tax Net income (loss) 4,862 - ,862 (6,666) (1,457) (8.123) S 4 S S 0.57 S Income (loss) per common share: Basic net income (loss) per share - continuing operations Basie net loss per share - discontinued operations Basic net income (loss) per share Diluted net income (loss) per share - continuing operations Diluted net loss per share - discontinued operations Diluted net income (loss) per share Weighted average shares outstanding - basic Weighted average shares outstanding - diluted (0.95) (0.21) (1.16) (0.95) (0.21) (1.16) 0.56 8,599 8,6124 7,015 7,015 Sec accompanying notes to consolidated financial stutcmcnts. FAMOUS DAVE'S OF AMERICA, INC. AND SUBSIDIARIES CONSOLIDATED STATEMENTS OF SHAREHOLDERS' EQUITY (in thousands) Additional Common Stock P aid-in Retained Shares Amoun Capital Farnings Total Balance - January 1, 2017 6,958 $ 66 $ S 19.902 $ 19.968 Issuance of common stock 418 4 1,460 1.464 Tax bcncfit for cquity awards issued (55) (55) Stock-based compensation 227 227 Net loss (8,123) (8,123) Balance - December 31, 2017 7,376 $ 70 $ 1,460 S 11.951 $ 13,481 Cumulative effect of change in accounting principle (1,738) (1,738) Common stock issued pursuant to rights offering 1,582 18 5,119 3.137 Excrcise of stock options 102 2 432 434 Stock-based compensation 364 365 Not income 4,862 4,862 Balance - December 30, 2018 9,085 $ 91 $ 7,375 S 15,075 $ 22.541 25 See accompanying notes to consolidated financial statements. F-4 70 FAMOUS DAVE'S OF AMERICA, INC. AND SUBSIDIARIES CONSOLIDATED STATEMENTS OF CASH FLOWS (in thousands) Year Endud December 30, 2018 December 31, 2017 Cash flows from operating activities: Net income (loss) from continuing operations $ 4.862 S (6,6661) Adjustments to reconcile net income (loss) to cash flows provided by operations: Depreciation and amortization 1,264 2.785 (Guin) loss from asset impairment and estimated lease crimination and other closing costs (46) 4,012 Net loss on disposal of property 29 Amortization of deferred financing costs 103 36 Amortization of lease interest assets 36 Deferred income taxes 639 (1,245) Deferred rent (654) 48 Bad debts (recovery) expense (30) 1.172 Stock-based compensation 278 313 Changes in operating assets and liabilities: Accounts receivable, nel (225) 141 Inventories (89) 467 Prepaid income taxes and income taxes receivable 103 1.479 Prepaid expenses and other current assets (570) 473 Other assets 312 Accounts payable (600) (946) Acurucd compensation and benefits (824) Other current liabilities 58 (567) Other liabilities (624) (139) Cash flows provided by continuing operating activities 3.877 1.779 Cash flows provided by discontinued operating activities 1,350 Cashllow's provided by operating activities 3,877 3,129 167 (3) Cash flows from investing activities: Proceeds from the sale of assets Payments for acquired restaurants Advances on notes receivable Purchases of held to maturity securities Maturity of held to maturity securities Purchases of property, cquipment and lvaschold improvements Cash flows used for continuing investing activities Cash flows used for discontinued investing activities Cash flows used for investing activities 1,187 (229) (750) (6,995) 6,995 (953) (745) (378) (378) 1.600 1,222 (745) Cash flows from financing activities: Payments for debt issuance costs Payments on long-term debt and financing lease obligations Proceeds from sale of common stock. net of offering costs Proceeds from cxcrcisc of stock options Cash flows used for financing activities (6,758) 5.120 (15) (1,538) 1.464 520 (1,118) (89) 4.262 Increase (decrease) in cash, cash equivalents and restricted cash Cash, cash equivalents and restricted cash, beginning of period Cash, cash equivalents and restricted cash, end of period 2,014 10,426 12.440) 6.10 $ $ 10.426 F-5 Year Ended December 30, 2018 December 31, 2017 Supplemental Disclosures Cash paid for interest Casli paid (relunds received) Tur incon S laxes, nel 292 S (148) 617 (1,842) Non-cash investing and financing activities: Change in deferred taxes, recognized in additional paid-in capital Increase (decrease) in accrued property and equipment purchases $ - 22 $ 55 14 See accompanying notes to consolidated financial statements. F-6


