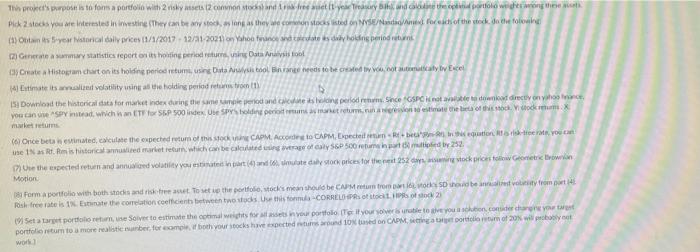
This project's purpose is to form a portfolio with 2 risky assets (2 common stocks) and a free auet it-year Treasury bhi and cite the opportfoloweghecaong these a Pick 2 stocks you are interested in investing (They can be any stock, as long as they are common stocks listed on NYSE/Nasdag/Amed for each of the stock, do the following (3) Obtain its 5-year historical daily prices (1/1/2017-12/31-2021) on Yahoo finance and calcolate as diy holding perind return (2) Generate a summary statistics report on its holting period returns, using Data Analysis tool (3) Create a Histogram chart on its holding period retums, using Data Analysis tool Brange needs to be created by you, not automatically by Excel (4) Estimate its analized volatility using all the holding period retas broen (1) 153 Download the historical data for market index during the same sample period and calculate its holding period retums. Since GSPC is not available to download directly on yahoo ance you can use "SPY instead, which is an ETF for S&P 500 index Use SPY's holding period reums as market returm, nun agression to estimate the beta of this stock. V stock rum. X market returns (6) Once beta is estimated, calculate the expected return of this stock uning CAPM. According to CAPM, Expected return-Rtbeta use 1% as Rt. Rm is historical annualized market return, which cant in this equation to risk-tree rate, you can culated using average of caly S&P 500 retums in part de multiplied by 252 17) Use the expected return and annualized volatility you estimated in part (4) and (6), simulate daly stock prices for the next 252 days, assuming stock prices follow Geometric Brownian Motion (8) Forma portfolio with both stocks and risk-free asset. To set up the portfolio, stocks mean should be CAPM retum trom part i storky SD should be annaltrest volinity from part 14 Risk free rate is 1%. Estimate the correlation coefficients between two stocks. Use this formula-CORRELO-PRs of stock1 PR of stock 21 (9) Set a target portfolio return, use Solver to estimate the optimal weights for all assets in your portfolio (Te if your solver is unable to give you a solution, consider changing your target portfolio return to a more realistic number, for example, if both your stocks have expected retums around 10% based on CAPM, setting a target portfolio return of 20% will probably not work) This project's purpose is to form a portfolio with 2 risky assets (2 common stocks) and a free auet it-year Treasury bhi and cite the opportfoloweghecaong these a Pick 2 stocks you are interested in investing (They can be any stock, as long as they are common stocks listed on NYSE/Nasdag/Amed for each of the stock, do the following (3) Obtain its 5-year historical daily prices (1/1/2017-12/31-2021) on Yahoo finance and calcolate as diy holding perind return (2) Generate a summary statistics report on its holting period returns, using Data Analysis tool (3) Create a Histogram chart on its holding period retums, using Data Analysis tool Brange needs to be created by you, not automatically by Excel (4) Estimate its analized volatility using all the holding period retas broen (1) 153 Download the historical data for market index during the same sample period and calculate its holding period retums. Since GSPC is not available to download directly on yahoo ance you can use "SPY instead, which is an ETF for S&P 500 index Use SPY's holding period reums as market returm, nun agression to estimate the beta of this stock. V stock rum. X market returns (6) Once beta is estimated, calculate the expected return of this stock uning CAPM. According to CAPM, Expected return-Rtbeta use 1% as Rt. Rm is historical annualized market return, which cant in this equation to risk-tree rate, you can culated using average of caly S&P 500 retums in part de multiplied by 252 17) Use the expected return and annualized volatility you estimated in part (4) and (6), simulate daly stock prices for the next 252 days, assuming stock prices follow Geometric Brownian Motion (8) Forma portfolio with both stocks and risk-free asset. To set up the portfolio, stocks mean should be CAPM retum trom part i storky SD should be annaltrest volinity from part 14 Risk free rate is 1%. Estimate the correlation coefficients between two stocks. Use this formula-CORRELO-PRs of stock1 PR of stock 21 (9) Set a target portfolio return, use Solver to estimate the optimal weights for all assets in your portfolio (Te if your solver is unable to give you a solution, consider changing your target portfolio return to a more realistic number, for example, if both your stocks have expected retums around 10% based on CAPM, setting a target portfolio return of 20% will probably not work)