this question is for people who are knowledable in how to run regressions using python in jupyter notebook
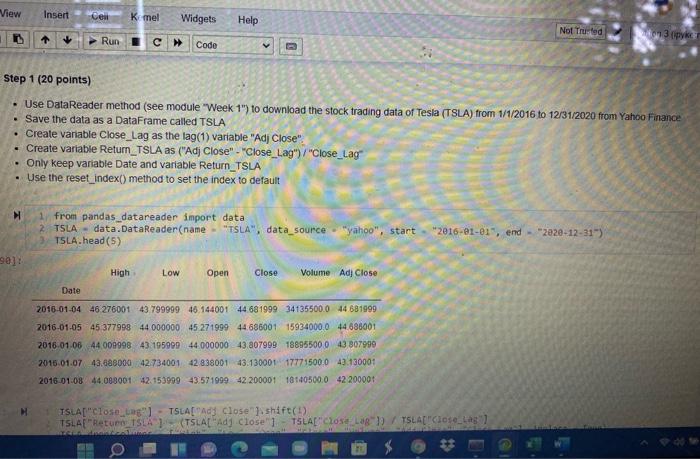
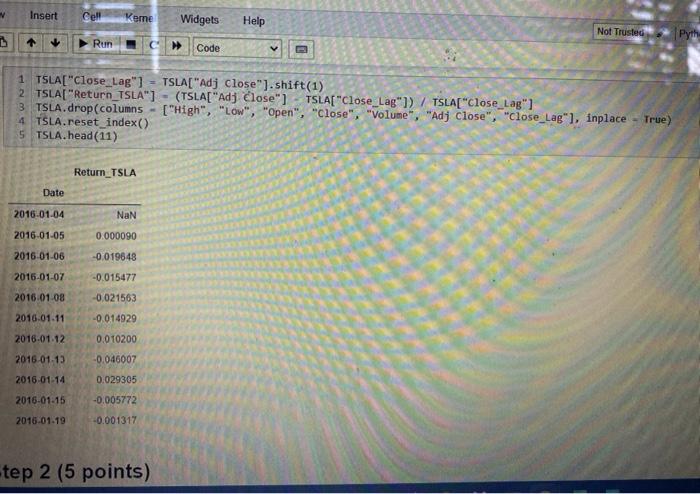
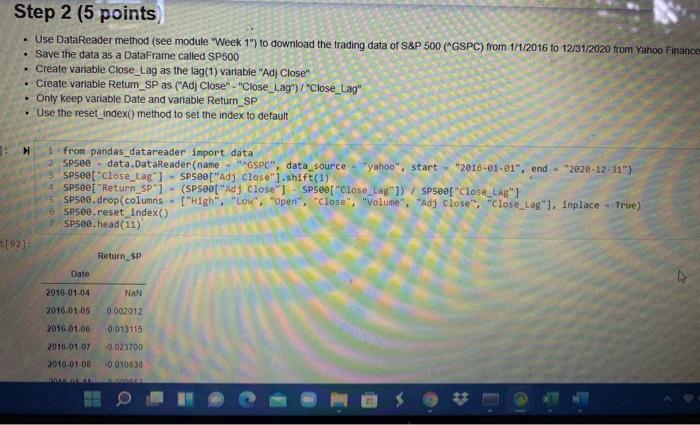
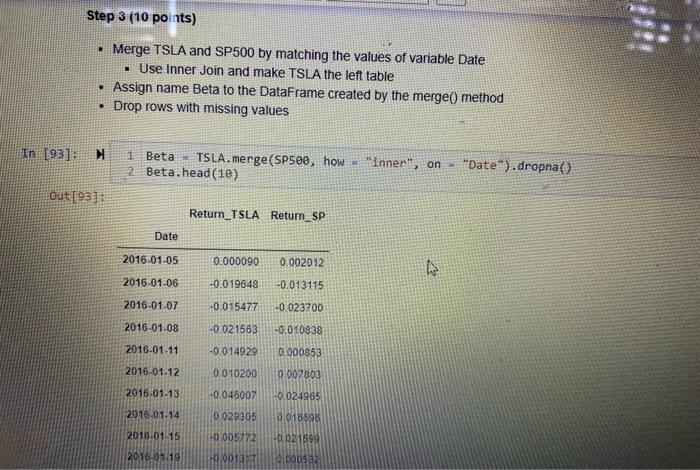
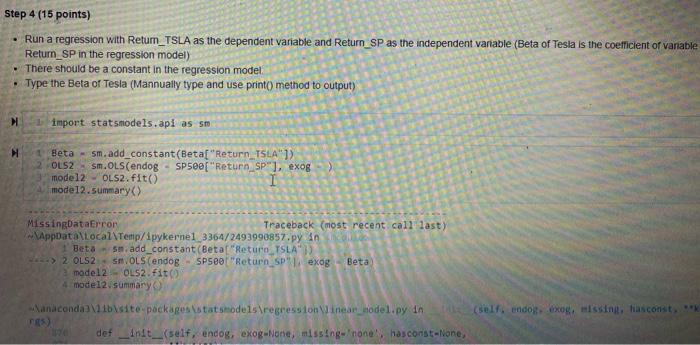
View Insert Cew K mel Widgets Help Not Trusted IL 3 ( Run Code Step 1 (20 points) Use DataReader method (see module "Week 1") to download the stock trading data of Tesla (TSLA) from 1/1/2016 to 12/31/2020 from Yahoo Finance Save the data as a DataFrame called TSLA Create variable Close_Lag as the lag(1) variable "Adj Close" Create variable Return_TSLA as ("Adj Close" - "Close_Lag")/"Close_Lag . Only keep variable Date and variable Return_TSLA . Use the reset_index() method to set the index to default from pandas_datareader import data 2 TSLA - data. DataReader(name - "TSLA", data_source "yahoo", TSLA.head (5) int 2016-01-01", end - "2e20-12-31") 90]: High Low Open Close Volume Adj Close Date 2018-01-04 46 276001 43.79999946. 144001 44 681999 341355000 44 681999 2016-01-05 45 377998 44 00000045 271999 44686001 159340000 44 686001 2016.01.06 44 009998 43. 195999 44.000000_43.807999188955000 43 807999 2016.01.07 43.68800042734001 42 838001 43.130001177715000 43.13000 2016-01-08 44.008001 42.153999 43,571999 42 200001 18140500.0 42200001 M TSLA["Close_ung TSLAE Ad Close shift(! TSLAE "Return TSLA) (TSLA[Ad Close" TSLA["Cose LaB ) / TSLA"Close_La O Step 2 (5 points Use DataReader method (see module "Week 1") to download the trading data of S&P 500 ("GSPC) from 1/1/2016 to 12/31/2020 from Yahoo Finance Save the data as a DataFrame called SP500 Create variable Close_Lag as the lag(1) variable "Adj Close" Create variable Return_SP as ("Ad Close" - "Close_Lag") / "Close_Lag" Only keep variable Date and variable Return_SP Use the reset_index(method to set the index to default 1 from pandas_datareader import data 2 SP500 - data. DataReader(name "AGSPC", data source - "yahoo", start "2016-01-01", end - 2020-12-31") SPSee["close_Lag"] SP500["Adj close").shift(1) SP500[ "Return_SP") (SP50e["Adj Close" SP500["close_Lag"1) SP500f"Close Lag"] SP500.drop(columns "high", "low", "open", "close", "volume", "Ady ciose", "close_las"), Inplace True) spseo.reset_index() SP500.head(11) 1021 Return_SP Date 2010.01.04 NAN 0.002012 -0.013115 2016.01.05 2016-01-06 2016-01-07 2016-01-08 -0.023700 0010838 Insert Cell Keme Widgets Help Not Trusted Pyth a Run C Code 1 TSLA["Close_Lag"] - TSLA[ "Adj Close").shift(1) 2 TSLA["Return_TSLA") - (TSLA["Adj close" ] TSLA["Close_Lag"]) / TSLA["Close_Lag"] 3 TSLA.drop(columns - ("High", "low", "Open", "Close", "volume", "Adj Close", "close_Lag"], inplace - True) 4 TSLA.reset_index() 5 TSLA.head(11) Return_TSLA Date 2016-01-04 NaN 2016-01-05 0.000090 2016-01-06 -0.019648 2016-01-07 -0.015477 2016.01.08 -0.021563 -0.014929 2016.01.11 2018.01.12 0.010200 2016.01.13 -0.046007 2016-01-14 0.029305 2016-01-15 -0.005772 2016-01-19 -0.001317 tep 2 (5 points) Step 2 (5 points Use DataReader method (see module "Week 1") to download the trading data of S&P 500 ("GSPC) from 1/1/2016 to 12/31/2020 from Yahoo Finance Save the data as a DataFrame called SP500 Create variable Close_Lag as the lag(1) variable "Adj Close" Create variable Return_SP as ("Ad Close" - "Close_Lag") / "Close_Lag" Only keep variable Date and variable Return_SP Use the reset_index() method to set the index to default . 1 from pandas_datareader import data SP500 data.DataReader(name - "AGSPO", data_source-"yahoo", start 2016-01-81", end - 2020-12-31") SPsee["close_tag") - SP500["Ady close").shift(1) SP500[ "Return_SP"] - (SP500[ "Ady Close" SP500["Close_Lag"]) VSP500["close_Lag"] SP500.drop(columns - ("High", "Low", "Open", "Close", "volume", "Adj close", "close_Lag"], Inplace - True) SP500.reset Index() SP500. head (11) t[92] Return_SP Date 4 NAN 2010-01-04 2016.01.05 0.002012 0013115 2016 01.06 2015-01.07 2010.01.08 -0.023700 -0.010030 Step 3 (10 points) Merge TSLA and SP500 by matching the values of variable Date Use Inner Join and make TSLA the left table Assign name Beta to the DataFrame created by the merge() method Drop rows with missing values . In 193]: 1 Beta TSLA.merge(SP500, how "inner", on 2 Beta.head(10) "Date").dropna() out [931 Return_TSLA Retum_SP Date 2016-01-05 0.000090 0.002012 2016-01-06 -0.019648 -0.013115 2016-01-07 -0.015477 -0.023700 2016-01-08 -0.021563 -0.010938 2016.01.11 -0.014929 0.000853 2016-01-12 0.010200 0.007803 2016-01-13 -0.046007 -0.024965 2018-01-14 0.029305 9016698 2015-01-15 +0.00 0.021899 0.000532 2016.01.19 0007 Step 4 (15 points) Run a regression with Retum_TSLA as the dependent variable and Return_SP as the independent vanable (Beta of Tesla is the coefficient of vanable Return_SP in the regression model) There should be a constant in the regression model Type the Beta of Tesla (Mannually type and use print method to output) import statsmodels.api as sm Beta - sm.add_constant(Beta "Return_TSLA")) OLS2 sm. OLS(endog - SP500["Return, SP), exog model2 OLS2. fit I mode12.5ummary() MissingDataError Traceback (most recent call last) AppData\Local\Temp/ipykernel_3364/2493990857.py in Beta 5m add_constant (Beta "Return_TSLA" > 2 OLS2 SOLS (endog SP500 "Return Sexog Beta model2 - OL52. fit() 4 model2 summary Wanacondaibisite-packages statsmodels regression Winear hodel.py in def Anit_(self, endog, exog-None, missing one has const- None, (self, endosexog, missint, fiasconst*** View Insert Cew K mel Widgets Help Not Trusted IL 3 ( Run Code Step 1 (20 points) Use DataReader method (see module "Week 1") to download the stock trading data of Tesla (TSLA) from 1/1/2016 to 12/31/2020 from Yahoo Finance Save the data as a DataFrame called TSLA Create variable Close_Lag as the lag(1) variable "Adj Close" Create variable Return_TSLA as ("Adj Close" - "Close_Lag")/"Close_Lag . Only keep variable Date and variable Return_TSLA . Use the reset_index() method to set the index to default from pandas_datareader import data 2 TSLA - data. DataReader(name - "TSLA", data_source "yahoo", TSLA.head (5) int 2016-01-01", end - "2e20-12-31") 90]: High Low Open Close Volume Adj Close Date 2018-01-04 46 276001 43.79999946. 144001 44 681999 341355000 44 681999 2016-01-05 45 377998 44 00000045 271999 44686001 159340000 44 686001 2016.01.06 44 009998 43. 195999 44.000000_43.807999188955000 43 807999 2016.01.07 43.68800042734001 42 838001 43.130001177715000 43.13000 2016-01-08 44.008001 42.153999 43,571999 42 200001 18140500.0 42200001 M TSLA["Close_ung TSLAE Ad Close shift(! TSLAE "Return TSLA) (TSLA[Ad Close" TSLA["Cose LaB ) / TSLA"Close_La O Step 2 (5 points Use DataReader method (see module "Week 1") to download the trading data of S&P 500 ("GSPC) from 1/1/2016 to 12/31/2020 from Yahoo Finance Save the data as a DataFrame called SP500 Create variable Close_Lag as the lag(1) variable "Adj Close" Create variable Return_SP as ("Ad Close" - "Close_Lag") / "Close_Lag" Only keep variable Date and variable Return_SP Use the reset_index(method to set the index to default 1 from pandas_datareader import data 2 SP500 - data. DataReader(name "AGSPC", data source - "yahoo", start "2016-01-01", end - 2020-12-31") SPSee["close_Lag"] SP500["Adj close").shift(1) SP500[ "Return_SP") (SP50e["Adj Close" SP500["close_Lag"1) SP500f"Close Lag"] SP500.drop(columns "high", "low", "open", "close", "volume", "Ady ciose", "close_las"), Inplace True) spseo.reset_index() SP500.head(11) 1021 Return_SP Date 2010.01.04 NAN 0.002012 -0.013115 2016.01.05 2016-01-06 2016-01-07 2016-01-08 -0.023700 0010838 Insert Cell Keme Widgets Help Not Trusted Pyth a Run C Code 1 TSLA["Close_Lag"] - TSLA[ "Adj Close").shift(1) 2 TSLA["Return_TSLA") - (TSLA["Adj close" ] TSLA["Close_Lag"]) / TSLA["Close_Lag"] 3 TSLA.drop(columns - ("High", "low", "Open", "Close", "volume", "Adj Close", "close_Lag"], inplace - True) 4 TSLA.reset_index() 5 TSLA.head(11) Return_TSLA Date 2016-01-04 NaN 2016-01-05 0.000090 2016-01-06 -0.019648 2016-01-07 -0.015477 2016.01.08 -0.021563 -0.014929 2016.01.11 2018.01.12 0.010200 2016.01.13 -0.046007 2016-01-14 0.029305 2016-01-15 -0.005772 2016-01-19 -0.001317 tep 2 (5 points) Step 2 (5 points Use DataReader method (see module "Week 1") to download the trading data of S&P 500 ("GSPC) from 1/1/2016 to 12/31/2020 from Yahoo Finance Save the data as a DataFrame called SP500 Create variable Close_Lag as the lag(1) variable "Adj Close" Create variable Return_SP as ("Ad Close" - "Close_Lag") / "Close_Lag" Only keep variable Date and variable Return_SP Use the reset_index() method to set the index to default . 1 from pandas_datareader import data SP500 data.DataReader(name - "AGSPO", data_source-"yahoo", start 2016-01-81", end - 2020-12-31") SPsee["close_tag") - SP500["Ady close").shift(1) SP500[ "Return_SP"] - (SP500[ "Ady Close" SP500["Close_Lag"]) VSP500["close_Lag"] SP500.drop(columns - ("High", "Low", "Open", "Close", "volume", "Adj close", "close_Lag"], Inplace - True) SP500.reset Index() SP500. head (11) t[92] Return_SP Date 4 NAN 2010-01-04 2016.01.05 0.002012 0013115 2016 01.06 2015-01.07 2010.01.08 -0.023700 -0.010030 Step 3 (10 points) Merge TSLA and SP500 by matching the values of variable Date Use Inner Join and make TSLA the left table Assign name Beta to the DataFrame created by the merge() method Drop rows with missing values . In 193]: 1 Beta TSLA.merge(SP500, how "inner", on 2 Beta.head(10) "Date").dropna() out [931 Return_TSLA Retum_SP Date 2016-01-05 0.000090 0.002012 2016-01-06 -0.019648 -0.013115 2016-01-07 -0.015477 -0.023700 2016-01-08 -0.021563 -0.010938 2016.01.11 -0.014929 0.000853 2016-01-12 0.010200 0.007803 2016-01-13 -0.046007 -0.024965 2018-01-14 0.029305 9016698 2015-01-15 +0.00 0.021899 0.000532 2016.01.19 0007 Step 4 (15 points) Run a regression with Retum_TSLA as the dependent variable and Return_SP as the independent vanable (Beta of Tesla is the coefficient of vanable Return_SP in the regression model) There should be a constant in the regression model Type the Beta of Tesla (Mannually type and use print method to output) import statsmodels.api as sm Beta - sm.add_constant(Beta "Return_TSLA")) OLS2 sm. OLS(endog - SP500["Return, SP), exog model2 OLS2. fit I mode12.5ummary() MissingDataError Traceback (most recent call last) AppData\Local\Temp/ipykernel_3364/2493990857.py in Beta 5m add_constant (Beta "Return_TSLA" > 2 OLS2 SOLS (endog SP500 "Return Sexog Beta model2 - OL52. fit() 4 model2 summary Wanacondaibisite-packages statsmodels regression Winear hodel.py in def Anit_(self, endog, exog-None, missing one has const- None, (self, endosexog, missint, fiasconst***