Answered step by step
Verified Expert Solution
Link Copied!

Question

1 Approved Answer

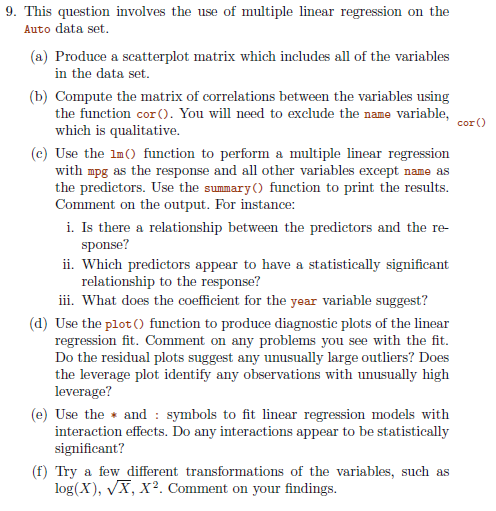
This question is from An Introduction to Statistical Learning and should be done in R. 9. This question involves the use of multiple linear regression

This question is from An Introduction to Statistical Learning and should be done in R.

image text in transcribed

9. This question involves the use of multiple linear regression on the Auto data set. (a) Produce a scatterplot matrix which includes all of the variables in the data set. (b) Compute the matrix of correlations between the variables using the function corO. You will need to exclude the name variable cor O which is qualitative (c) Use the 1mO function to perform a multiple linear regression with mpg as the response and all other variables except name as the predictors. Use the summary function to print the results. Comment on the output. For instance: i. Is there a relationship between the predictors and the re- sponse? ii. Which predictors appear to have a statistically significant relationship to the response? iii. What does the coefficient for the year variable suggest? (d) Use the plotO function to produce diagnostic plots of the linear regression fit. Comment on any problems you see with the fit Do the residual plots suggest any unusually large outliers? Does the leverage plot identify any observations with unusually high leverage? (e) Use the and symbols to fit linear regression models with (f) Try a few different transformations of the variables, such as log(X), VX, X2. Comment on your findings. 9. This question involves the use of multiple linear regression on the Auto data set. (a) Produce a scatterplot matrix which includes all of the variables in the data set. (b) Compute the matrix of correlations between the variables using the function corO. You will need to exclude the name variable cor O which is qualitative (c) Use the 1mO function to perform a multiple linear regression with mpg as the response and all other variables except name as the predictors. Use the summary function to print the results. Comment on the output. For instance: i. Is there a relationship between the predictors and the re- sponse? ii. Which predictors appear to have a statistically significant relationship to the response? iii. What does the coefficient for the year variable suggest? (d) Use the plotO function to produce diagnostic plots of the linear regression fit. Comment on any problems you see with the fit Do the residual plots suggest any unusually large outliers? Does the leverage plot identify any observations with unusually high leverage? (e) Use the and symbols to fit linear regression models with (f) Try a few different transformations of the variables, such as log(X), VX, X2. Comment on your findings

Step by Step Solution

There are 3 Steps involved in it

Step: 1

blur-text-image

Get Instant Access to Expert-Tailored Solutions

See step-by-step solutions with expert insights and AI powered tools for academic success

Step: 2

blur-text-image

Step: 3

blur-text-image

Ace Your Homework with AI

Get the answers you need in no time with our AI-driven, step-by-step assistance

Get Started

Recommended Textbook for

Secrets Of Analytical Leaders Insights From Information Insiders

Authors: Wayne Eckerson

1st Edition

1935504347, 9781935504344

More Books

Students also viewed these Databases questions

Question

What are the challenges associated with tunneling in urban areas?

Answered: 1 week ago

Question

What are the main differences between rigid and flexible pavements?

Answered: 1 week ago

Question

What is the purpose of a retaining wall, and how is it designed?

Answered: 1 week ago

Question

How do you determine the load-bearing capacity of a soil?

Answered: 1 week ago

Question

what is Edward Lemieux effect / Anomeric effect ?

Answered: 1 week ago