Question: This question was posted before. I have solved the question but i am not sure. In order to be sure, I posted here. Please tell
This question was posted before. I have solved the question but i am not sure. In order to be sure, I posted here. Please tell me what you need. If you need excel file, by googling, you will see the data in Chegg which was posted before. 
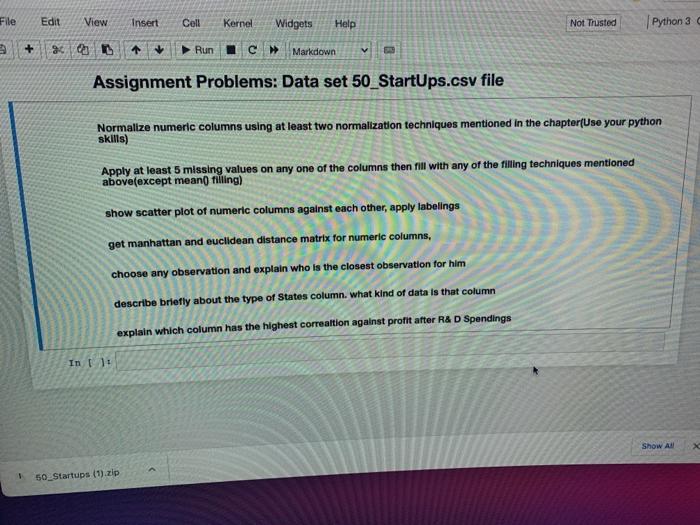
File Edit View Insert Cell Kernel Widgets Help Not Trusted Python 3 4 Run C >> Markdown v Assignment Problems: Data set 50_StartUps.csv file Normalize numeric columns using at least two normalization techniques mentioned in the chapter(Use your python skills) Apply at least 5 missing values on any one of the columns then fill with any of the filling techniques mentioned above(except mean filling) show scatter plot of numeric columns against each other, apply labelings get manhattan and euclidean distance matrix for numeric columns, choose any observation and explain who is the closest observation for him describe briefly about the type of States column. what kind of data is that column explain which column has the highest correaltion against profit after R&D Spendings In ] Show All 50_Startups (1).zip
Step by Step Solution
There are 3 Steps involved in it

Get step-by-step solutions from verified subject matter experts


