

Question
This question will have you calculating 2 EOQ, ROP and Total Cost values and interpreting the results. For both EOQ and ROP values, give your
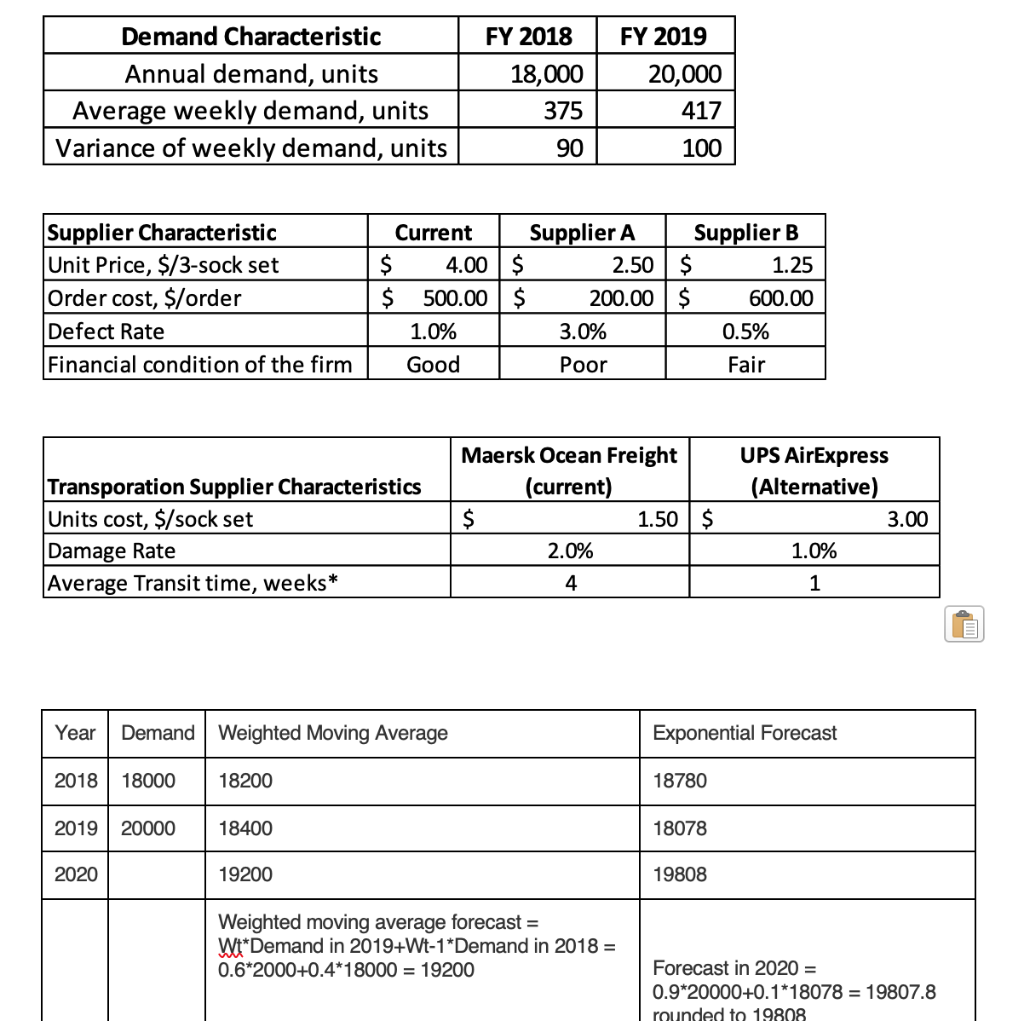
This question will have you calculating 2 EOQ, ROP and Total Cost values and interpreting the results. For both EOQ and ROP values, give your final answer in full sock sets (ROUND UP to the next whole number). The specific questions to answer are based in parts a-c. Tips to solve the EOQ and ROP are given below in bullet points.
a) Calculate EOQ and ROP for FY2019 based on the FY2019 forecast value, using the forecast method posted
FY 2018 FY 2019 Demand Characteristic Annual demand, units Average weekly demand, units Variance of weekly demand, units 18,000 375 20,000 417 90 100 Supplier Characteristic Unit Price, $/3-sock set Order cost, $/order Defect Rate Financial condition of the firm Current Supplier A Supplier B $ 4.00 $ 2.50 $ 1.25 $ 500.00 $ 200.00 $ 600.00 1.0% 3.0% 0.5% Good Poor Fair Transporation Supplier Characteristics Units cost, $/sock set Damage Rate Average Transit time, weeks* Maersk Ocean Freight (current) $ 1.50 $ 2.0% UPS AirExpress (Alternative) 3.00 1.0% 4 1 Year Demand Weighted Moving Average Exponential Forecast 2018 18000 18200 18780 2019 20000 18400 18078 2020 19200 19808 Weighted moving average forecast = Wt*Demand in 2019+Wt-1*Demand in 2018 = 0.6*2000+0.4*18000 = 19200 Forecast in 2020 = 0.9*20000+0.1*18078 = 19807.8 rounded to 19808 FY 2018 FY 2019 Demand Characteristic Annual demand, units Average weekly demand, units Variance of weekly demand, units 18,000 375 20,000 417 90 100 Supplier Characteristic Unit Price, $/3-sock set Order cost, $/order Defect Rate Financial condition of the firm Current Supplier A Supplier B $ 4.00 $ 2.50 $ 1.25 $ 500.00 $ 200.00 $ 600.00 1.0% 3.0% 0.5% Good Poor Fair Transporation Supplier Characteristics Units cost, $/sock set Damage Rate Average Transit time, weeks* Maersk Ocean Freight (current) $ 1.50 $ 2.0% UPS AirExpress (Alternative) 3.00 1.0% 4 1 Year Demand Weighted Moving Average Exponential Forecast 2018 18000 18200 18780 2019 20000 18400 18078 2020 19200 19808 Weighted moving average forecast = Wt*Demand in 2019+Wt-1*Demand in 2018 = 0.6*2000+0.4*18000 = 19200 Forecast in 2020 = 0.9*20000+0.1*18078 = 19807.8 rounded to 19808Step by Step Solution
There are 3 Steps involved in it
Step: 1

Get Instant Access to Expert-Tailored Solutions
See step-by-step solutions with expert insights and AI powered tools for academic success
Step: 2

Step: 3
Ace Your Homework with AI
Get the answers you need in no time with our AI-driven, step-by-step assistance
Get Started
Financial Regulation In The Global Economy
Authors: Richard J. Herring , Robert E. Litan
1st Edition
0815791550, 9780815752837, 9780815791553