Answered step by step
Verified Expert Solution
Question
1 Approved Answer
This section gives in total 22 points. We are estimating the salary of CEOS in US firms using a dataset with 177 observations. We
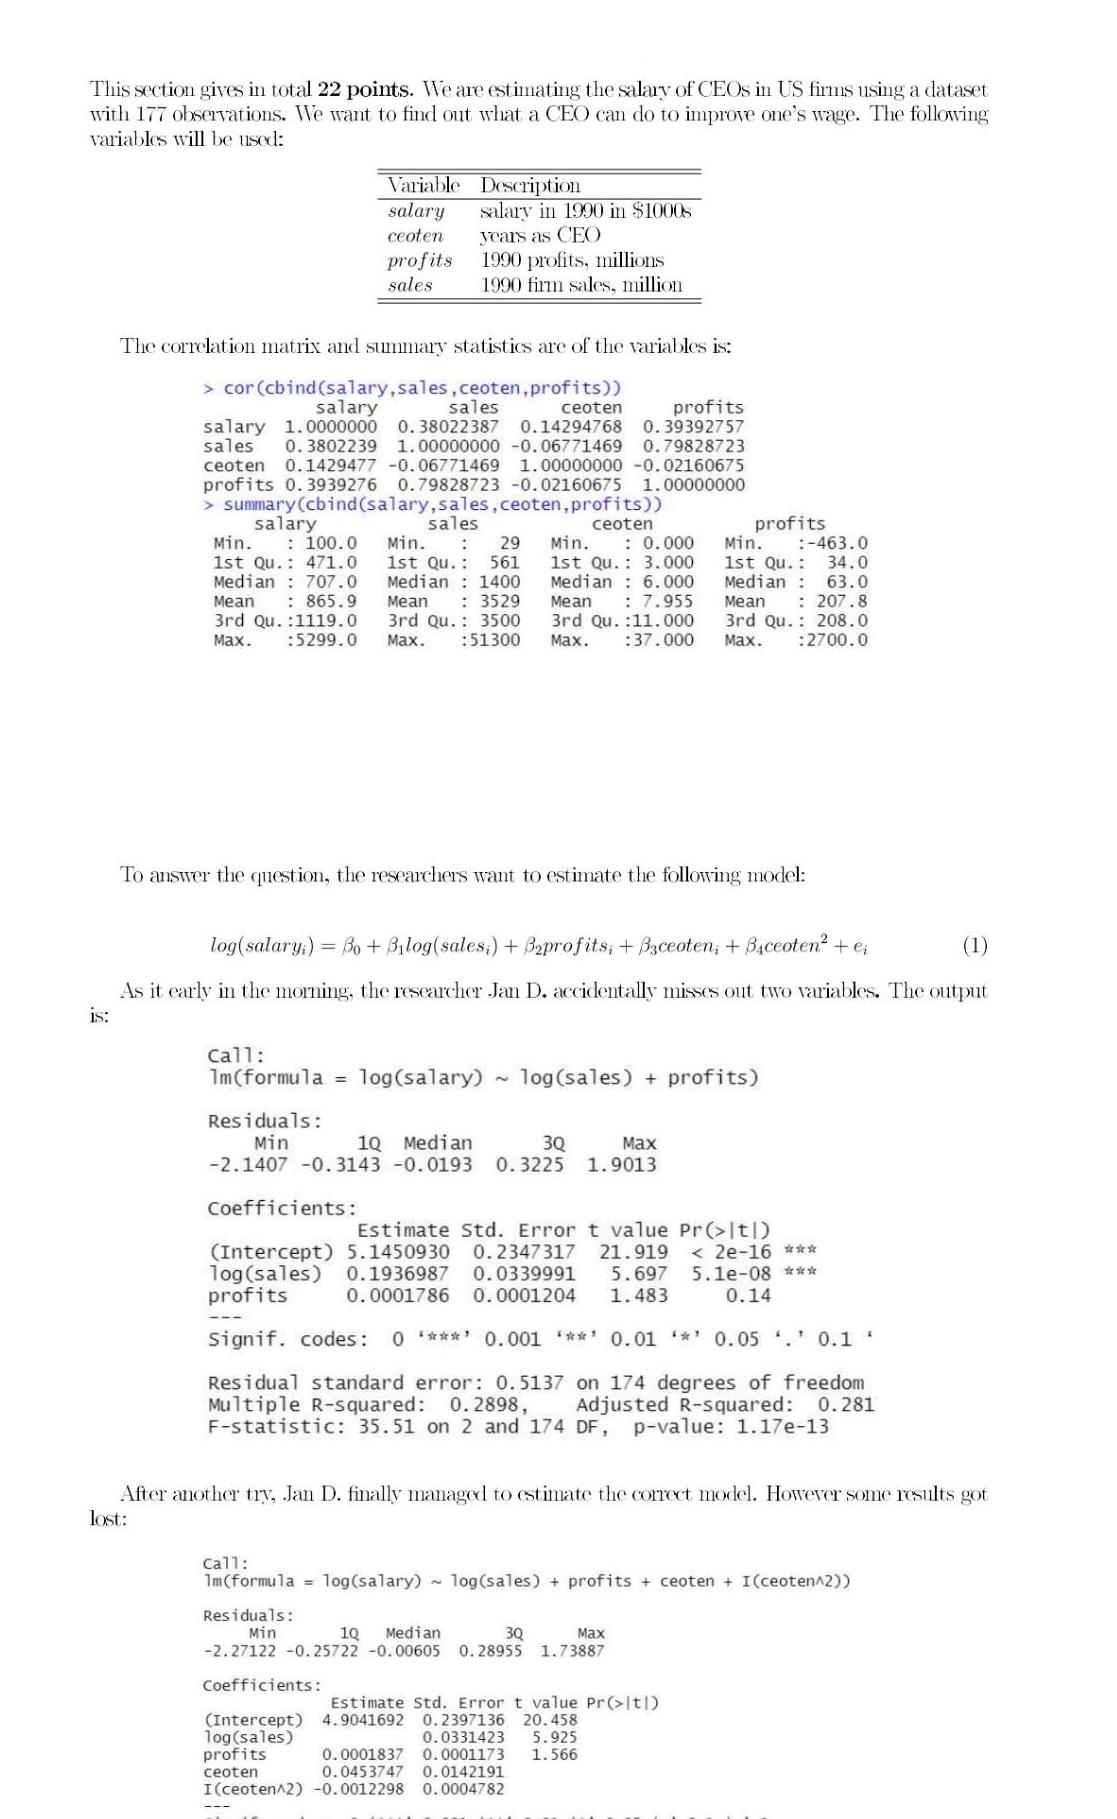
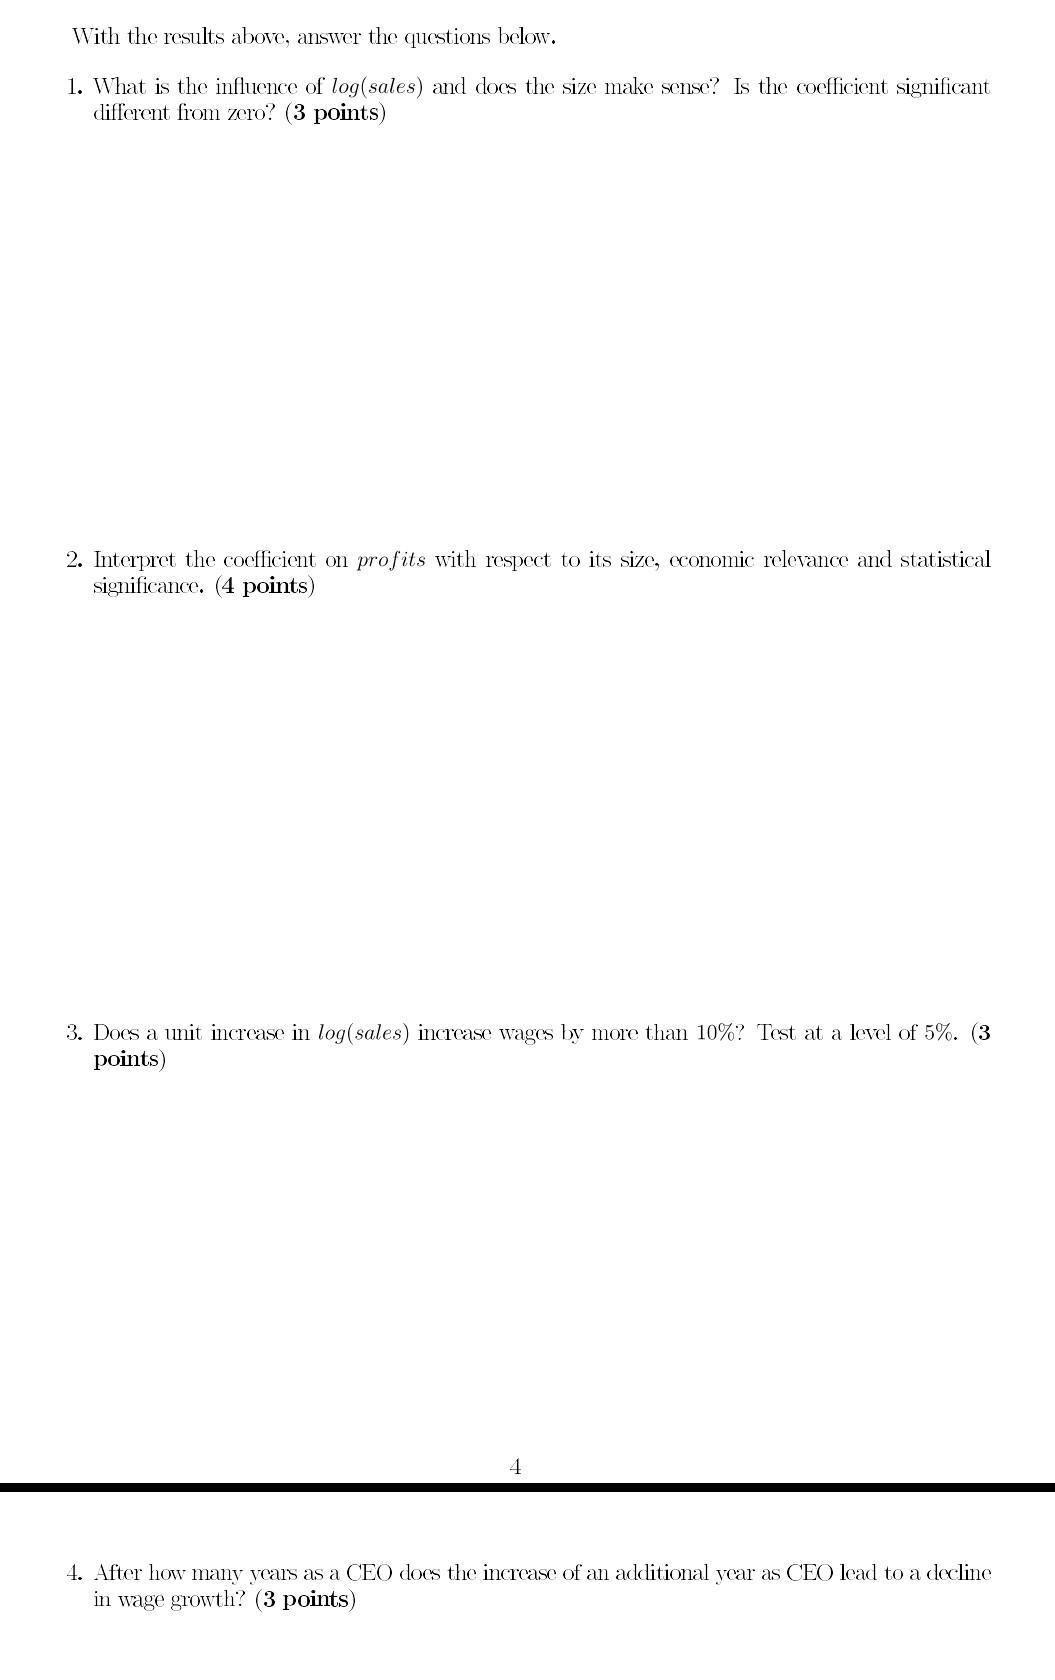
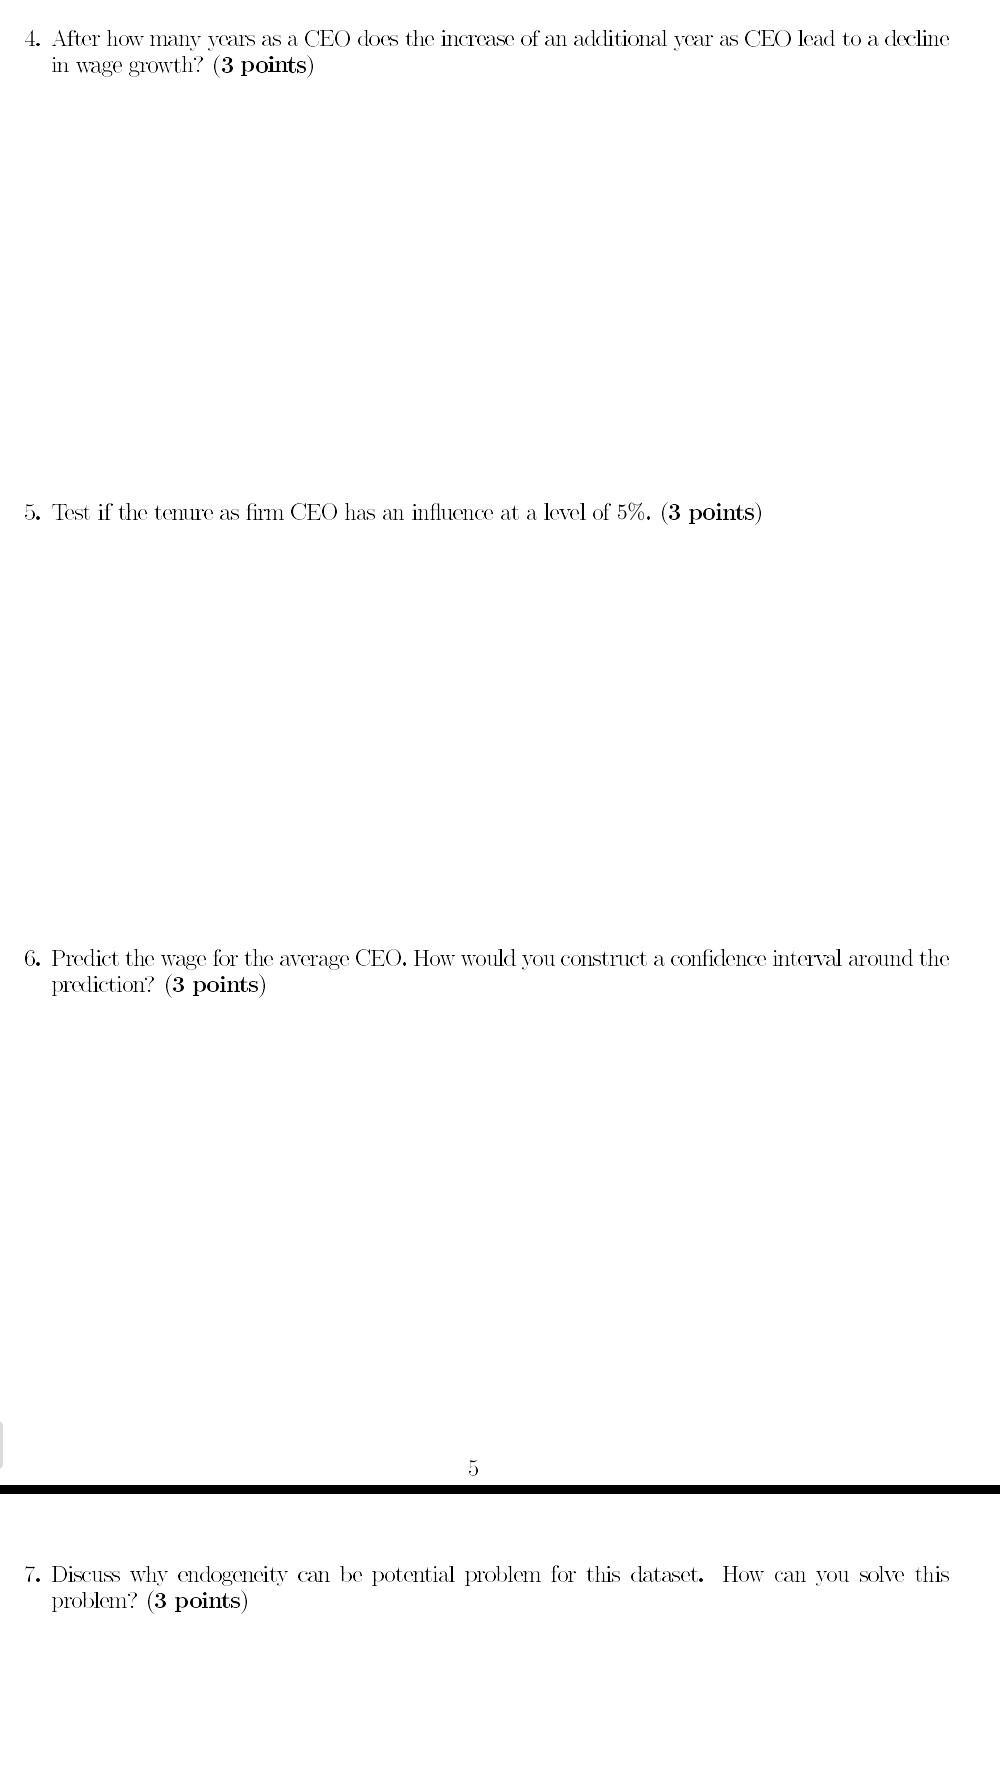
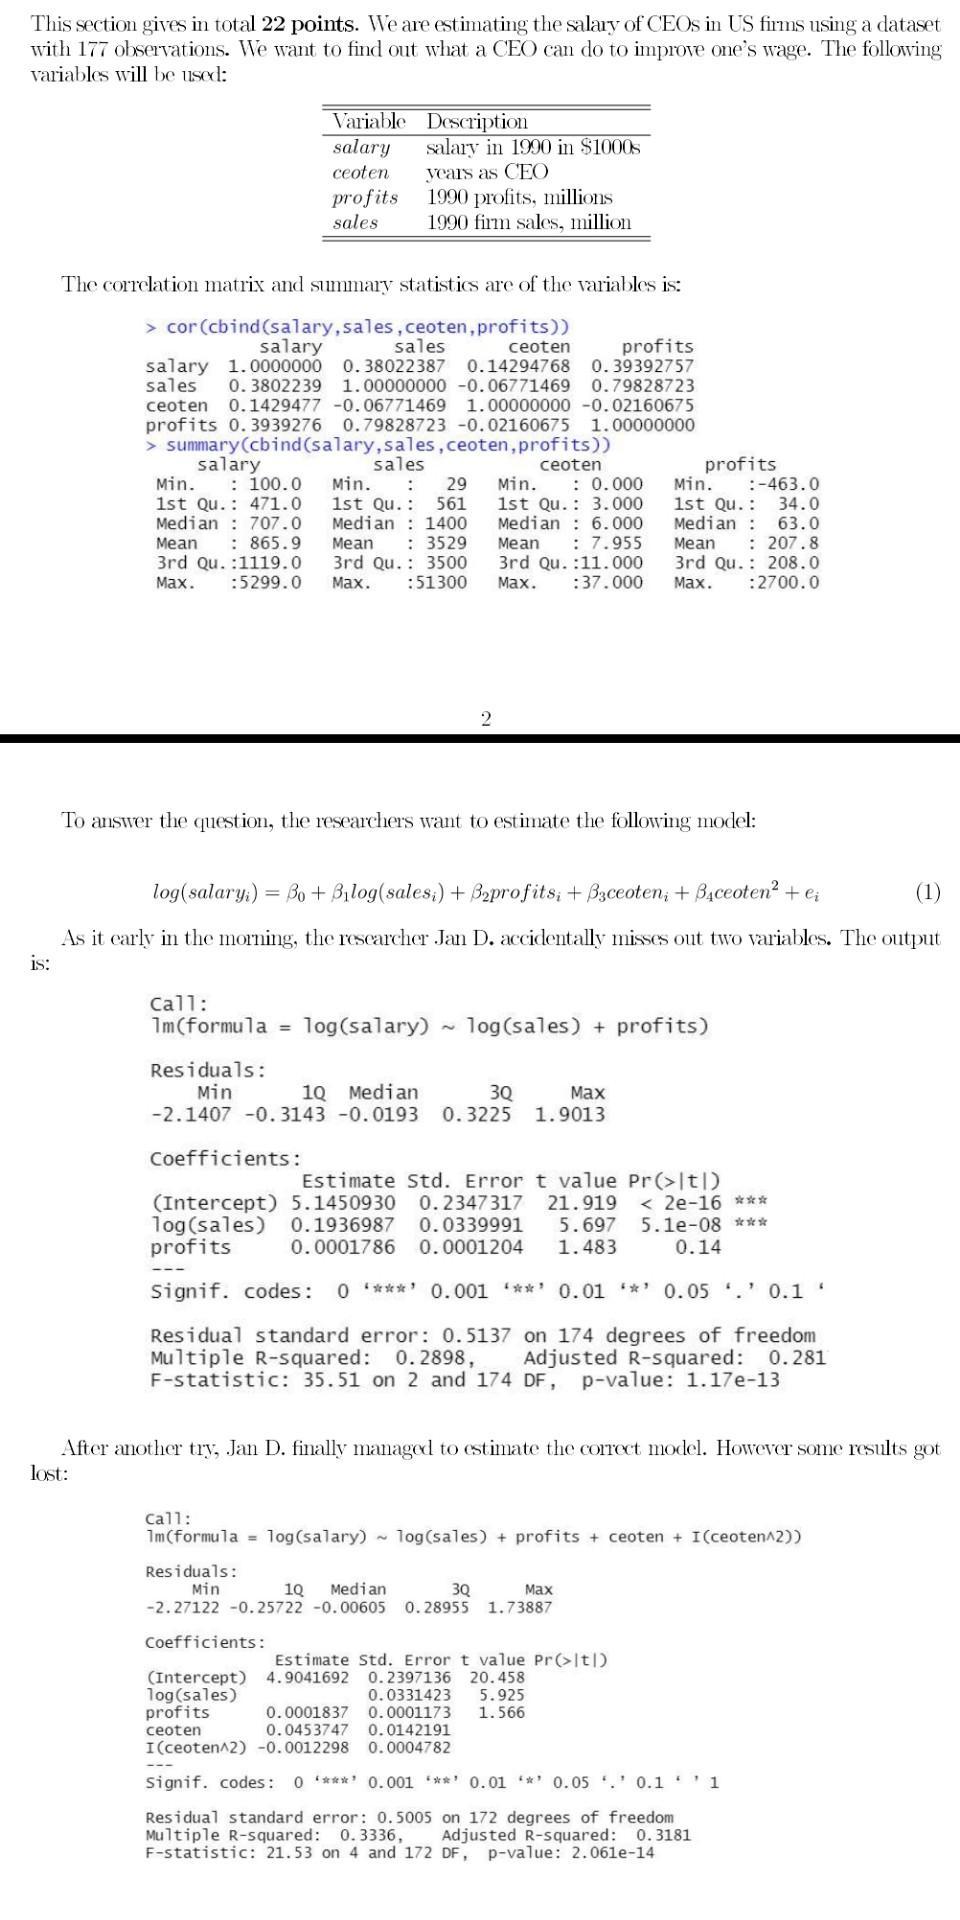
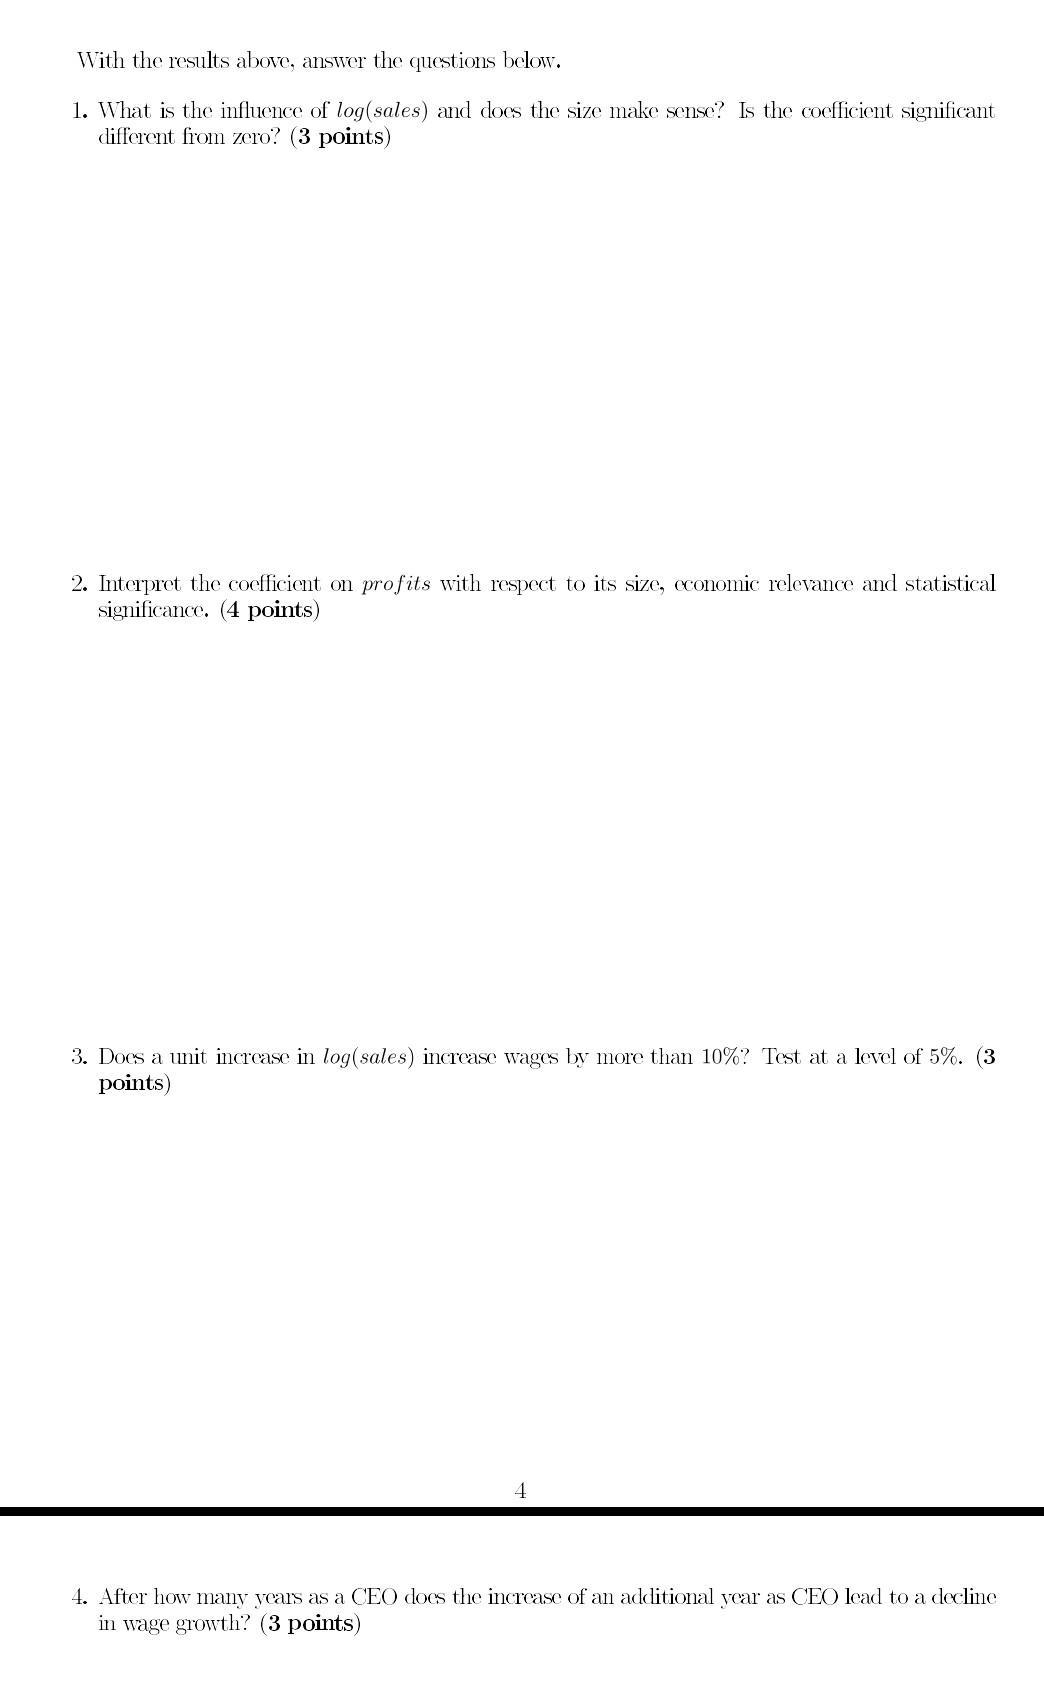
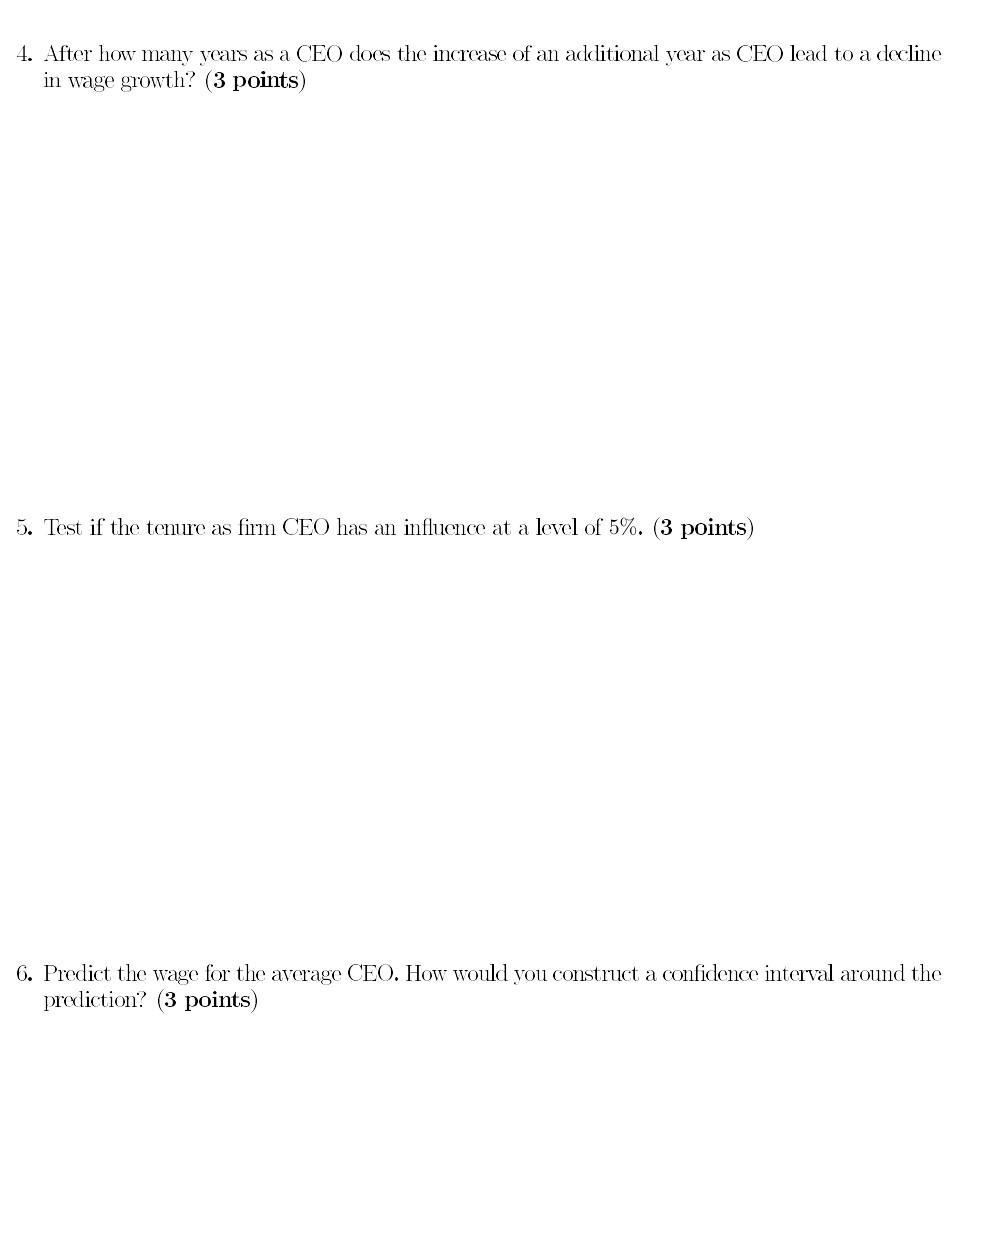
This section gives in total 22 points. We are estimating the salary of CEOS in US firms using a dataset with 177 observations. We want to find out what a CEO can do to improve one's wage. The following variables will be used: Variable salary ceoten profits sales Description salary in 1990 in $1000s years as CEO 1990 profits, millions 1990 firm sales, million. The correlation matrix and summary statistics are of the variables is: > cor (cbind(salary, sales, ceoten, profits)) salary sales profits 0.39392757 ceoten salary 1.0000000 0.38022387 0.14294768 sales 0.3802239 1.00000000 -0.06771469 0.79828723 ceoten 0.1429477 -0.06771469 1.00000000 -0.02160675 profits 0.3939276 0.79828723 -0.02160675 1.00000000 > summary (cbind(salary, sales, ceoten, profits)) sales ceoten salary Min. : 100.0 Min. : 29 Min. : 0.000 1st Qu.: 471.0 1st Qu. : 561 Median 707.0 Median 1400 Mean : 865.9 Mean : 3529 3rd Qu. :1119.0 3rd Qu. : 3500 Max. :5299.0 Max. :51300 1st Qu. : 3.000 Median 6.000 Mean : 7.955 3rd Qu. :11.000 Max. :37.000 To answer the question, researchers want to estimate the following model: log(salary;) = Bo + Bilog(sales;) + Bprofits; + Baceoten; + Baceoten. + ei (1) As it early in the morning, the researcher Jan D. accidentally misses out two variables. The output is: Call: 1m (formula = log(salary) log(sales) + profits) Residuals: 3Q Max Min 10 Median -2.1407 -0.3143 -0.0193 0.3225 1.9013 Residuals: Min profits Min. :-463.0 1st Qu. : 34.0 Median : 63.0 Mean : 207.8 3rd Qu.: 208.0 Max. :2700.0 Coefficients: Estimate Std. Error t value Pr(>1t|) (Intercept) 5.1450930 0.2347317 21.919 < 2e-16 *** log(sales) 0.1936987 0.0339991 5.697 5.1e-08 *** profits 0.0001786 0.0001204 1.483 0.14 Signif. codes: 0 **** 0.001 *** 0.01 * 0.05 .' 0.1 * Residual standard error: 0.5137 on 174 degrees of freedom Multiple R-squared: 0.2898, Adjusted R-squared: 0.281 F-statistic: 35.51 on 2 and 174 DF, p-value: 1.17e-13 After another try, Jan D. finally managed to estimate the correct model. However some results got lost: Call: 1m (formula = log(salary) log(sales) + profits + ceoten + I (ceoten^2)) 3Q Max 1Q Median -2.27122 -0.25722 -0.00605 0.28955 1.73887 Coefficients: Estimate Std. Error t value Pr(>ltl) (Intercept) 4.9041692 0.2397136 20.458 log(sales) 0.0331423 5.925 profits 0.0001837 0.0001173 1.566 ceoten 0.0453747 0.0142191 I(ceoten^2) -0.0012298 0.0004782 With the results above, answer the questions below. 1. What is the influence of log(sales) and does the size make sense? Is the coefficient significant different from zero? (3 points) 2. Interpret the coefficient on profits with respect to its size, economic relevance and statistical significance. (4 points) 3. Does a unit increase in log(sales) increase wages by more than 10%? Test at a level of 5%. (3 points) 4 4. After how many years as a CEO does the increase of an additional year as CEO lead to a decline in wage growth? (3 points) 4. After how many years as a CEO does the increase of an additional year as CEO lead to a decline in wage growth? (3 points) 5. Test if the tenure as firm CEO has an influence at a level of 5%. (3 points) 6. Predict the wage for the average CEO. How would you construct a confidence interval around the prediction? (3 points) 7. Discuss why endogeneity can be potential problem for this dataset. How can you solve this problem? (3 points) This section gives in total 22 points. We are estimating the salary of CEOS in US firms using a dataset with 177 observations. We want to find out what a CEO can do to improve one's wage. The following variables will be used: The correlation matrix and summary statistics are of the variables is: > cor (cbind(salary, sales, ceoten, profits)) salary sales profits 0.39392757 ceoten salary 1.0000000 0.38022387 0.14294768 sales 0.3802239 1.00000000 -0.06771469 0.79828723 ceoten 0.1429477 -0.06771469 1.00000000 -0.02160675 profits 0.3939276 0.79828723 -0.02160675 1.00000000 > summary (cbind(salary, sales, ceoten, profits)) sales ceoten Variable salary ceoten salary Min. : 100.0 Min. : 29 1st Qu.: 471.0 1st Qu. : 561 Median 707.0 Median 1400 Mean : 3529 3rd Qu. : 3500 Max. :51300 Mean : 865.9 3rd Qu. :1119.0 Max. :5299.0 profits sales = Description salary in 1990 in $1000s years as CEO 1990 profits, millions 1990 firm sales, million Residuals: Min To answer the question, the researchers want to estimate the following model: log(salary;) Bo+Bilog(salesi) + B2profits; +33ceoten; + Baceoten + ei (1) As it early in the morning, the researcher Jan D. accidentally misses out two variables. The output is: Call: 1m(formula = log(salary) Min. : 0.000 1st Qu. : 3.000 Median 6.000 Mean : 7.955 3rd Qu. :11.000 Max. :37.000 Residuals: Min 3Q 1Q Median -2.1407 -0.3143 -0.0193 0.3225 Coefficients: log(sales) + profits) profits 34.0 63.0 Min. :-463.0 1st Qu. : Median : Mean : 207.8 3rd Qu.: 208.0 Max. :2700.0 Max 1.9013 Coefficients: Estimate Std. Error t value Pr(>1t|) (Intercept) 5.1450930 0.2347317 21.919 < 2e-16 *** log(sales) 0.1936987 0.0339991 5.697 5.1e-08 *** profits 0.0001786 0.0001204 1.483 0.14 Signif. codes: 0 *** 0.001 '**' 0.01 **' 0.05 '.' 0.1 ' Residual standard error: 0.5137 on 174 degrees of freedom Multiple R-squared: 0.2898, Adjusted R-squared: 0.281 F-statistic: 35.51 on 2 and 174 DF, p-value: 1.17e-13 After another try, Jan D. finally managed to estimate the correct model. However some results got lost: Call: 1m (formula = log(salary) log(sales) + profits + ceoten + I(ceoten^2)) 3Q Max 1Q Median -2.27122 -0.25722 -0.00605 0.28955 1.73887 Estimate Std. Error t value Pr(>|t|) (Intercept) 4.9041692 0.2397136 20.458 log(sales) 0.0331423 profits 5.925 0.0001173 1.566 ceoten 0.0001837 0.0453747 0.0142191 I(ceoten^2) -0.0012298 0.0004782 Signif. codes: 0 ***** 0.001*** 0.01 *** 0.05.0.1 1 Residual standard error: 0.5005 on 172 degrees of freedom Multiple R-squared: 0.3336, Adjusted R-squared: 0.3181 F-statistic: 21.53 on 4 and 172 DF, p-value: 2.061e-14 With the results above, answer the questions below. 1. What is the influence of log(sales) and does the size make sense? Is the coefficient significant different from zero? (3 points) 2. Interpret the coefficient on profits with respect to its size, economic relevance and statistical significance. (4 points) 3. Does a unit increase in log(sales) increase wages by more than 10%? Test at a level of 5%. (3 points) 4 4. After how many years as a CEO does the increase of an additional year as CEO lead to a decline in wage growth? (3 points) 4. After how many years as a CEO does the increase of an additional year as CEO lead to a decline in wage growth? (3 points) 5. Test if the tenure as firm CEO has an influence at a level of 5%. (3 points) 6. Predict the wage for the average CEO. How would you construct a confidence interval around the prediction? (3 points)
Step by Step Solution
There are 3 Steps involved in it
Step: 1

Get Instant Access to Expert-Tailored Solutions
See step-by-step solutions with expert insights and AI powered tools for academic success
Step: 2

Step: 3

Ace Your Homework with AI
Get the answers you need in no time with our AI-driven, step-by-step assistance
Get Started


