

Answered step by step
Verified Expert Solution
Question
1 Approved Answer
This table reports the regression coefficients when the returns of the size - institutional ownership portfolio ( columns 1 and 2 ) returns are regressed
This table reports the regression coefficients when the returns of the sizeinstitutional ownership portfolio columns and returns are regressed on three variables: a constant column the stock market returns column and the change of the value weighted discount of the closed end fund industry column Columns and report the corresponding t statistics of the coefficient estimates. Note that a tstatistic with an absolute value above means the coefficient estimate is significantly different from at the level. Column reports the R square of the regressions. Column reports the mean institutional ownership of each portfolio. The last column reports the Fstatistics for a multivariate test of the null hypothesis that the coefficient on Delta VWD in the Low L ownership portfolio is equal to the High H ownership portfolio. Twotailed pvalues are in parentheses. What is the main finding of this Table? What is the explanation for the finding? 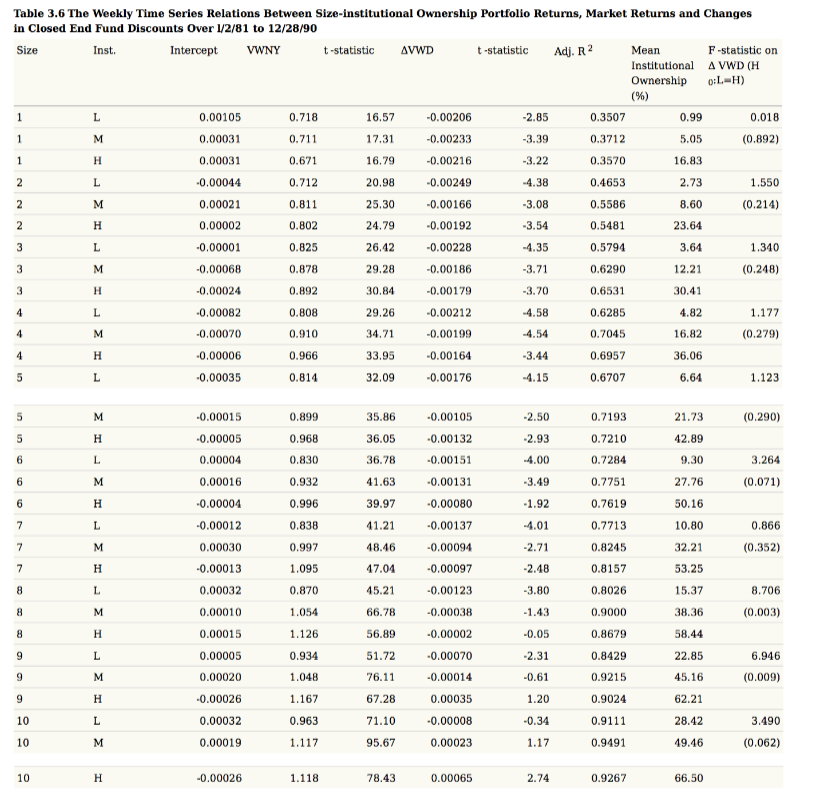
This table reports the regression coefficients when the returns of the sizeinstitutional
ownership portfolio columns and returns are regressed on three variables: a constant
column the stock market returns column and the change of the value weighted discount
of the closed end fund industry column Columns and report the corresponding t
statistics of the coefficient estimates. Note that a tstatistic with an absolute value above
means the coefficient estimate is significantly different from at the level. Column
reports the R square of the regressions. Column reports the mean institutional ownership of
each portfolio. The last column reports the Fstatistics for a multivariate test of the null
hypothesis that the coefficient on Delta VWD in the Low L ownership portfolio is equal to the
High H ownership portfolio. Twotailed pvalues are in parentheses.
What is the main finding of this Table?
What is the explanation for the finding?
Step by Step Solution
There are 3 Steps involved in it
Step: 1

Get Instant Access to Expert-Tailored Solutions
See step-by-step solutions with expert insights and AI powered tools for academic success
Step: 2

Step: 3
Ace Your Homework with AI
Get the answers you need in no time with our AI-driven, step-by-step assistance
Get Started
Electronic Waste An Actual Gold And Silver Mine
Authors: Antonio Alcivar
1st Edition
979-8367641059