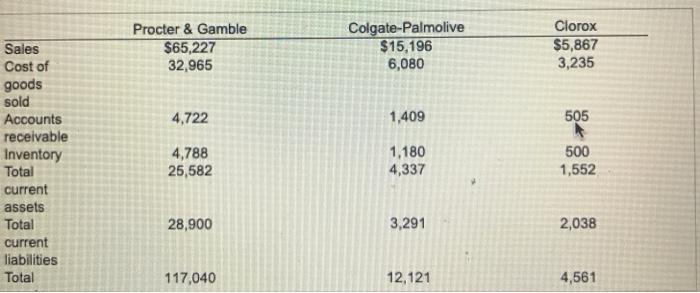
This table .. shows 2017 total revenues, cost of goods sold, camings avaliable for common stockholders, total assets, and stockholders' equity for three companies competing in the bottled drinks market the Coca-Cola Company, Pepsico Inc., and Dr. Pepper Snapple Group. All dollar values are in thousands 2. Use the information given to analyze each firm's profitability in as many different ways as you can. Which company is most profitable? Is this a difficult question to anser? b. For each company, ROE is greater than ROA. Why is that so? Look at the difference between ROE and ROA for each company. Does that difference help you determine which firm uses the highest percentage of debt to finance its activities? .. The net profit margin for Coca-cola is % (Enter as a percentage and round to one decimal place) Procter & Gamble $65,227 32,965 Colgate-Palmolive $15,196 6,080 Clorox $5,867 3,235 4,722 1,409 505 Sales Cost of goods sold Accounts receivable Inventory Total current assets Total current liabilities Total 4,788 25,582 1,180 4,337 500 1,552 28,900 3,291 2,038 117,040 12,121 4,561 This table .. shows 2017 total revenues, cost of goods sold, camings avaliable for common stockholders, total assets, and stockholders' equity for three companies competing in the bottled drinks market the Coca-Cola Company, Pepsico Inc., and Dr. Pepper Snapple Group. All dollar values are in thousands 2. Use the information given to analyze each firm's profitability in as many different ways as you can. Which company is most profitable? Is this a difficult question to anser? b. For each company, ROE is greater than ROA. Why is that so? Look at the difference between ROE and ROA for each company. Does that difference help you determine which firm uses the highest percentage of debt to finance its activities? .. The net profit margin for Coca-cola is % (Enter as a percentage and round to one decimal place) Procter & Gamble $65,227 32,965 Colgate-Palmolive $15,196 6,080 Clorox $5,867 3,235 4,722 1,409 505 Sales Cost of goods sold Accounts receivable Inventory Total current assets Total current liabilities Total 4,788 25,582 1,180 4,337 500 1,552 28,900 3,291 2,038 117,040 12,121 4,561


