

Question: = This test: 150 point(s) possible p ELL L LR This question: 8 point(s) possible @ S LU L According to flightstats.com, American Airfines fli
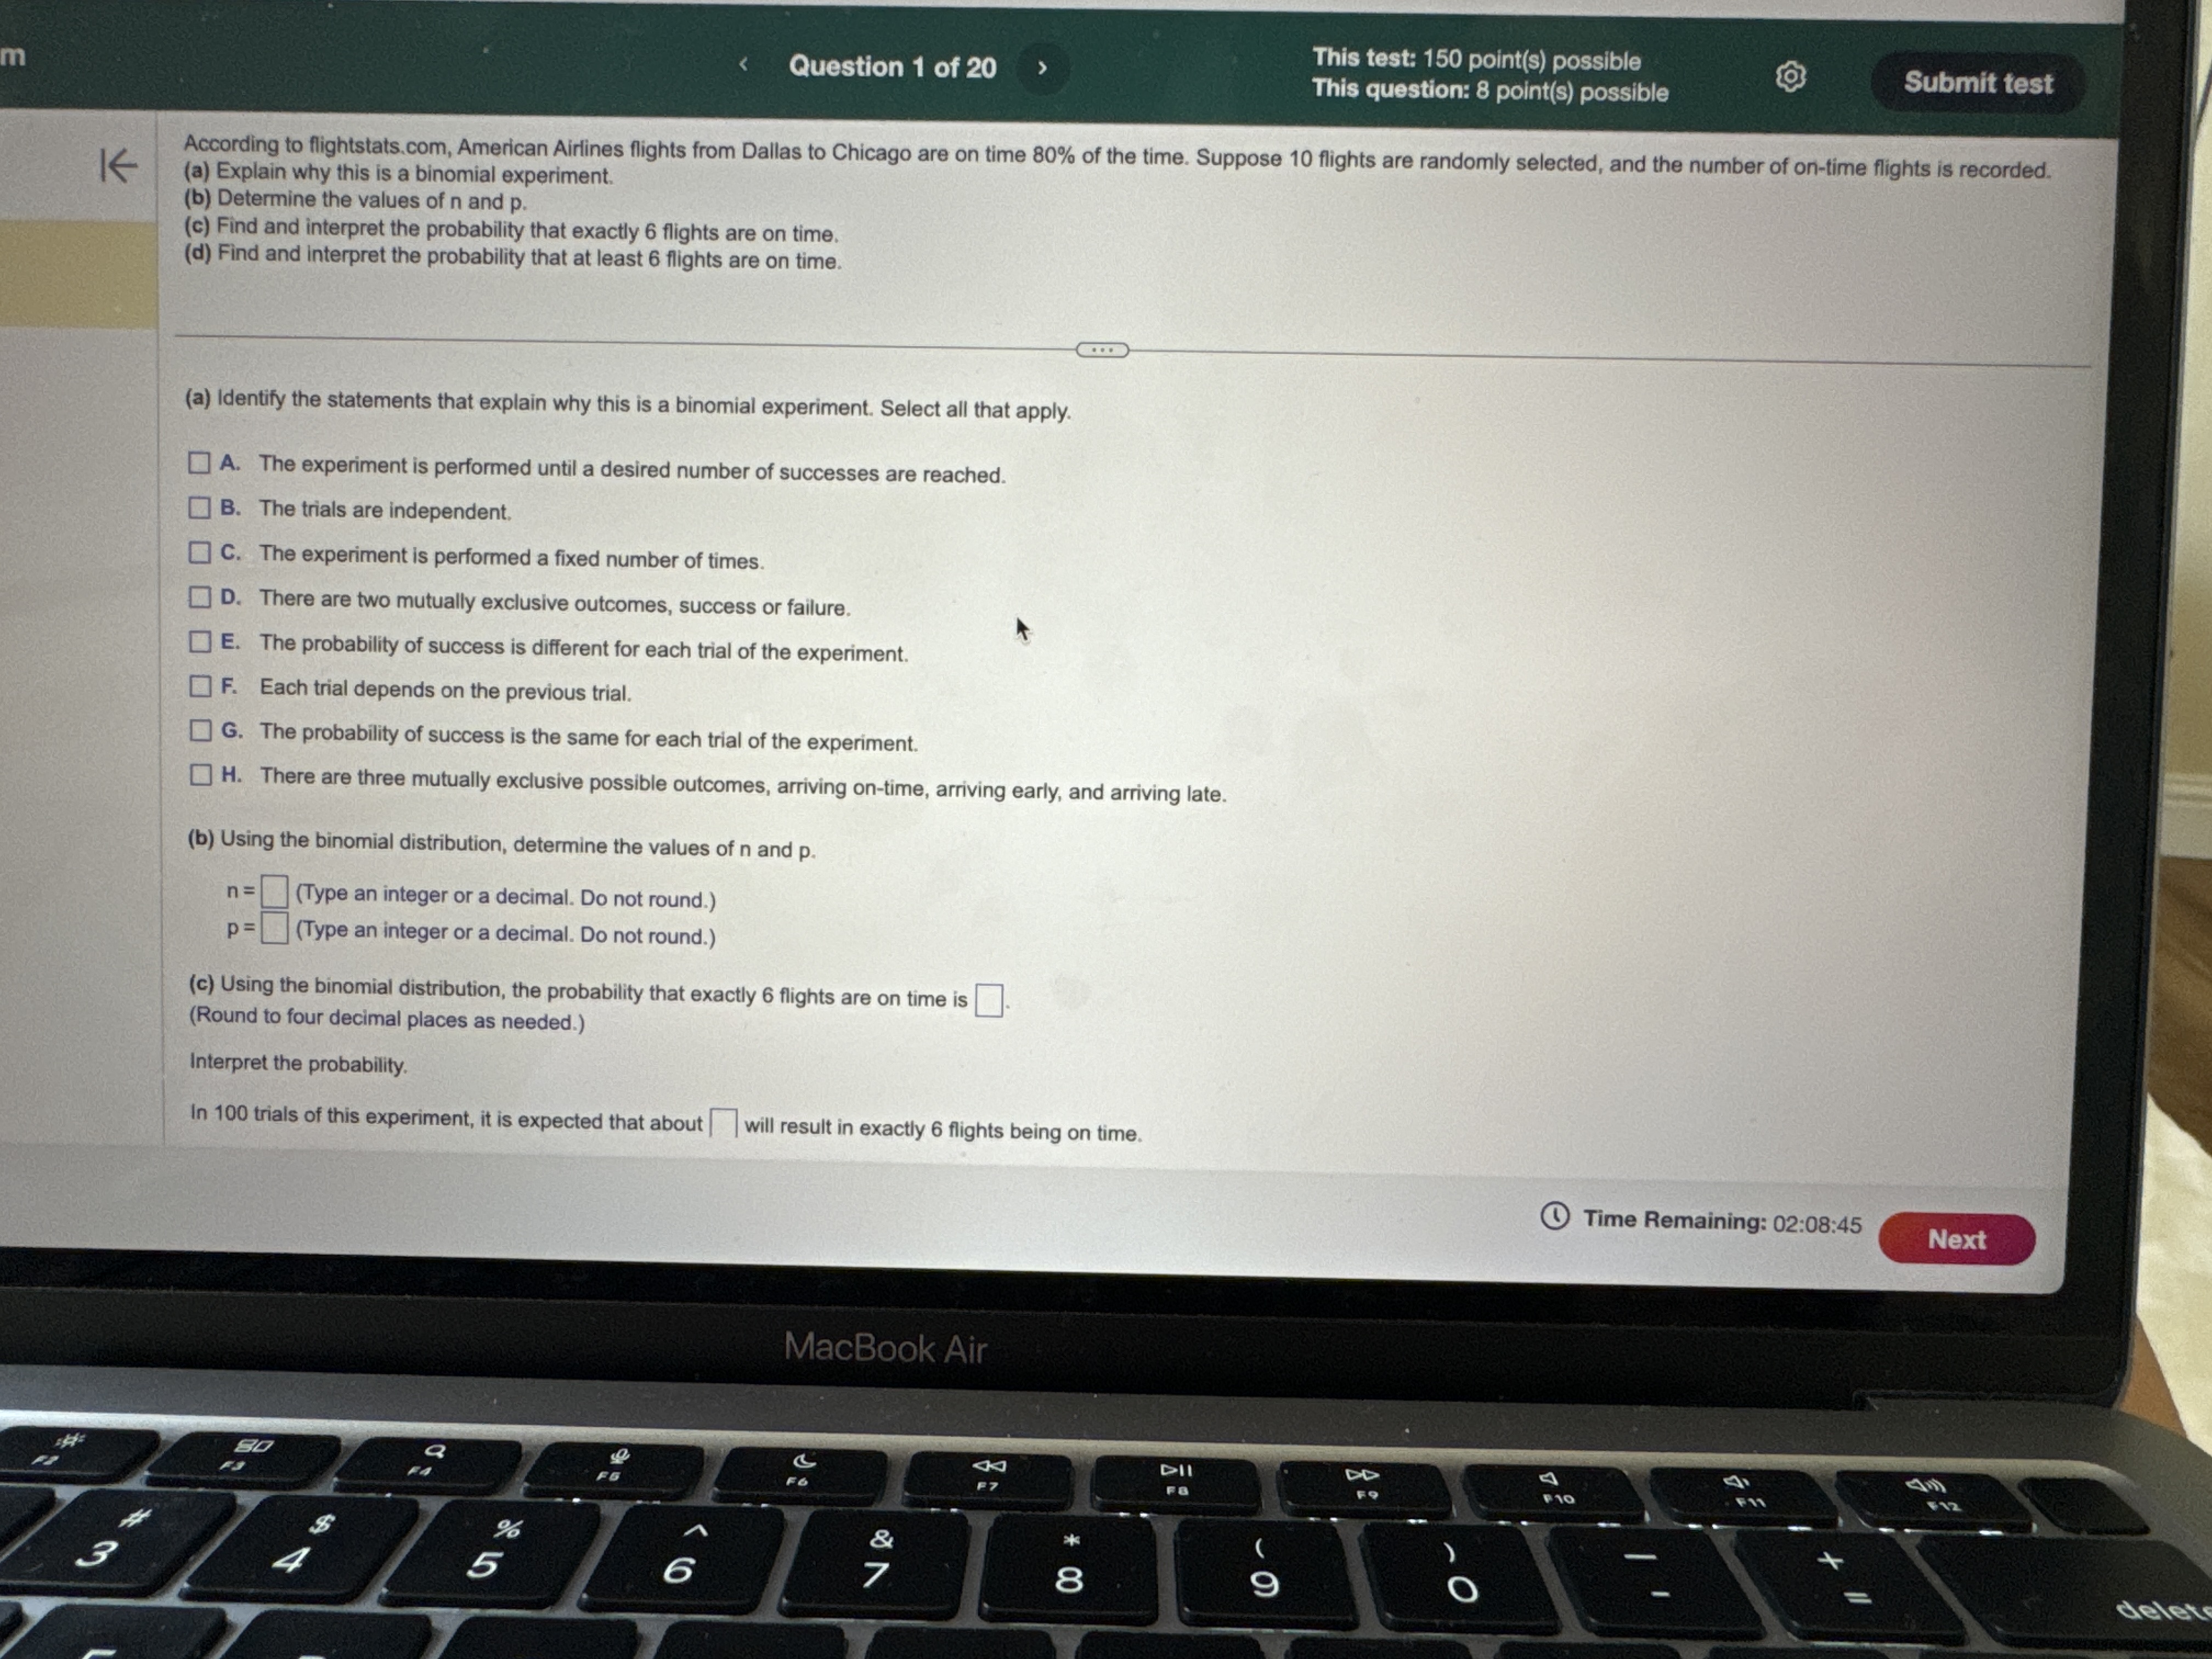
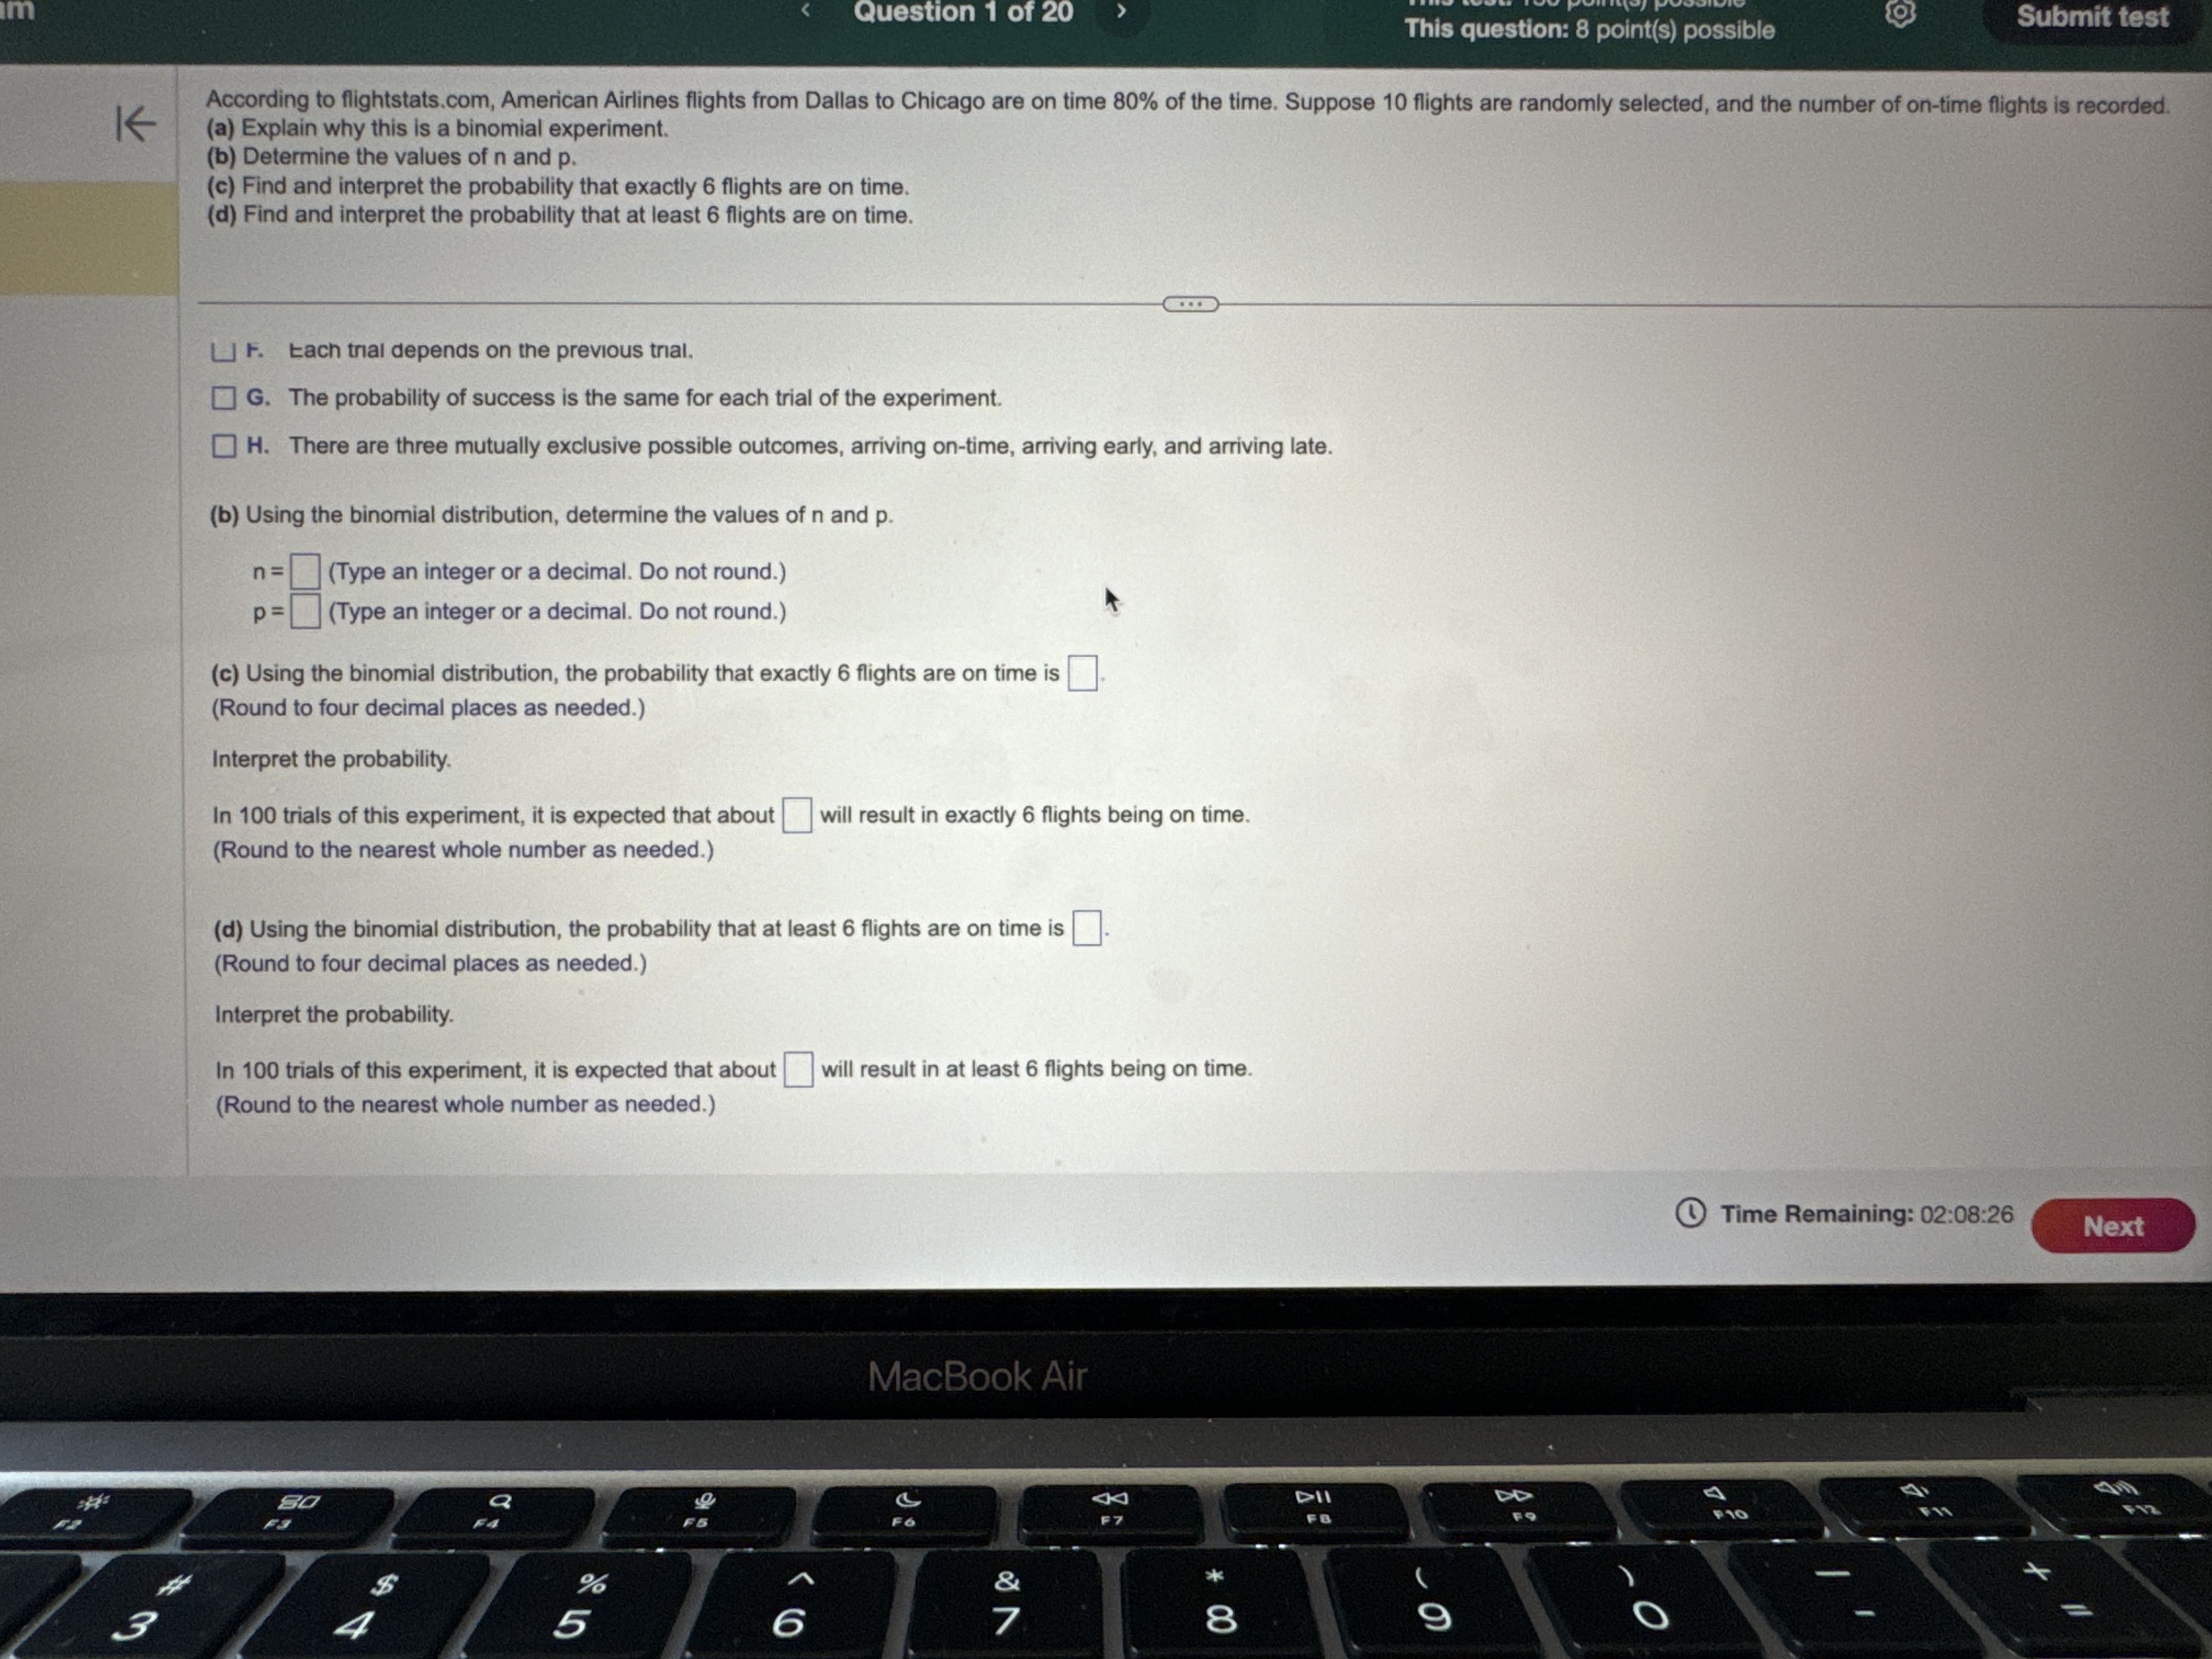

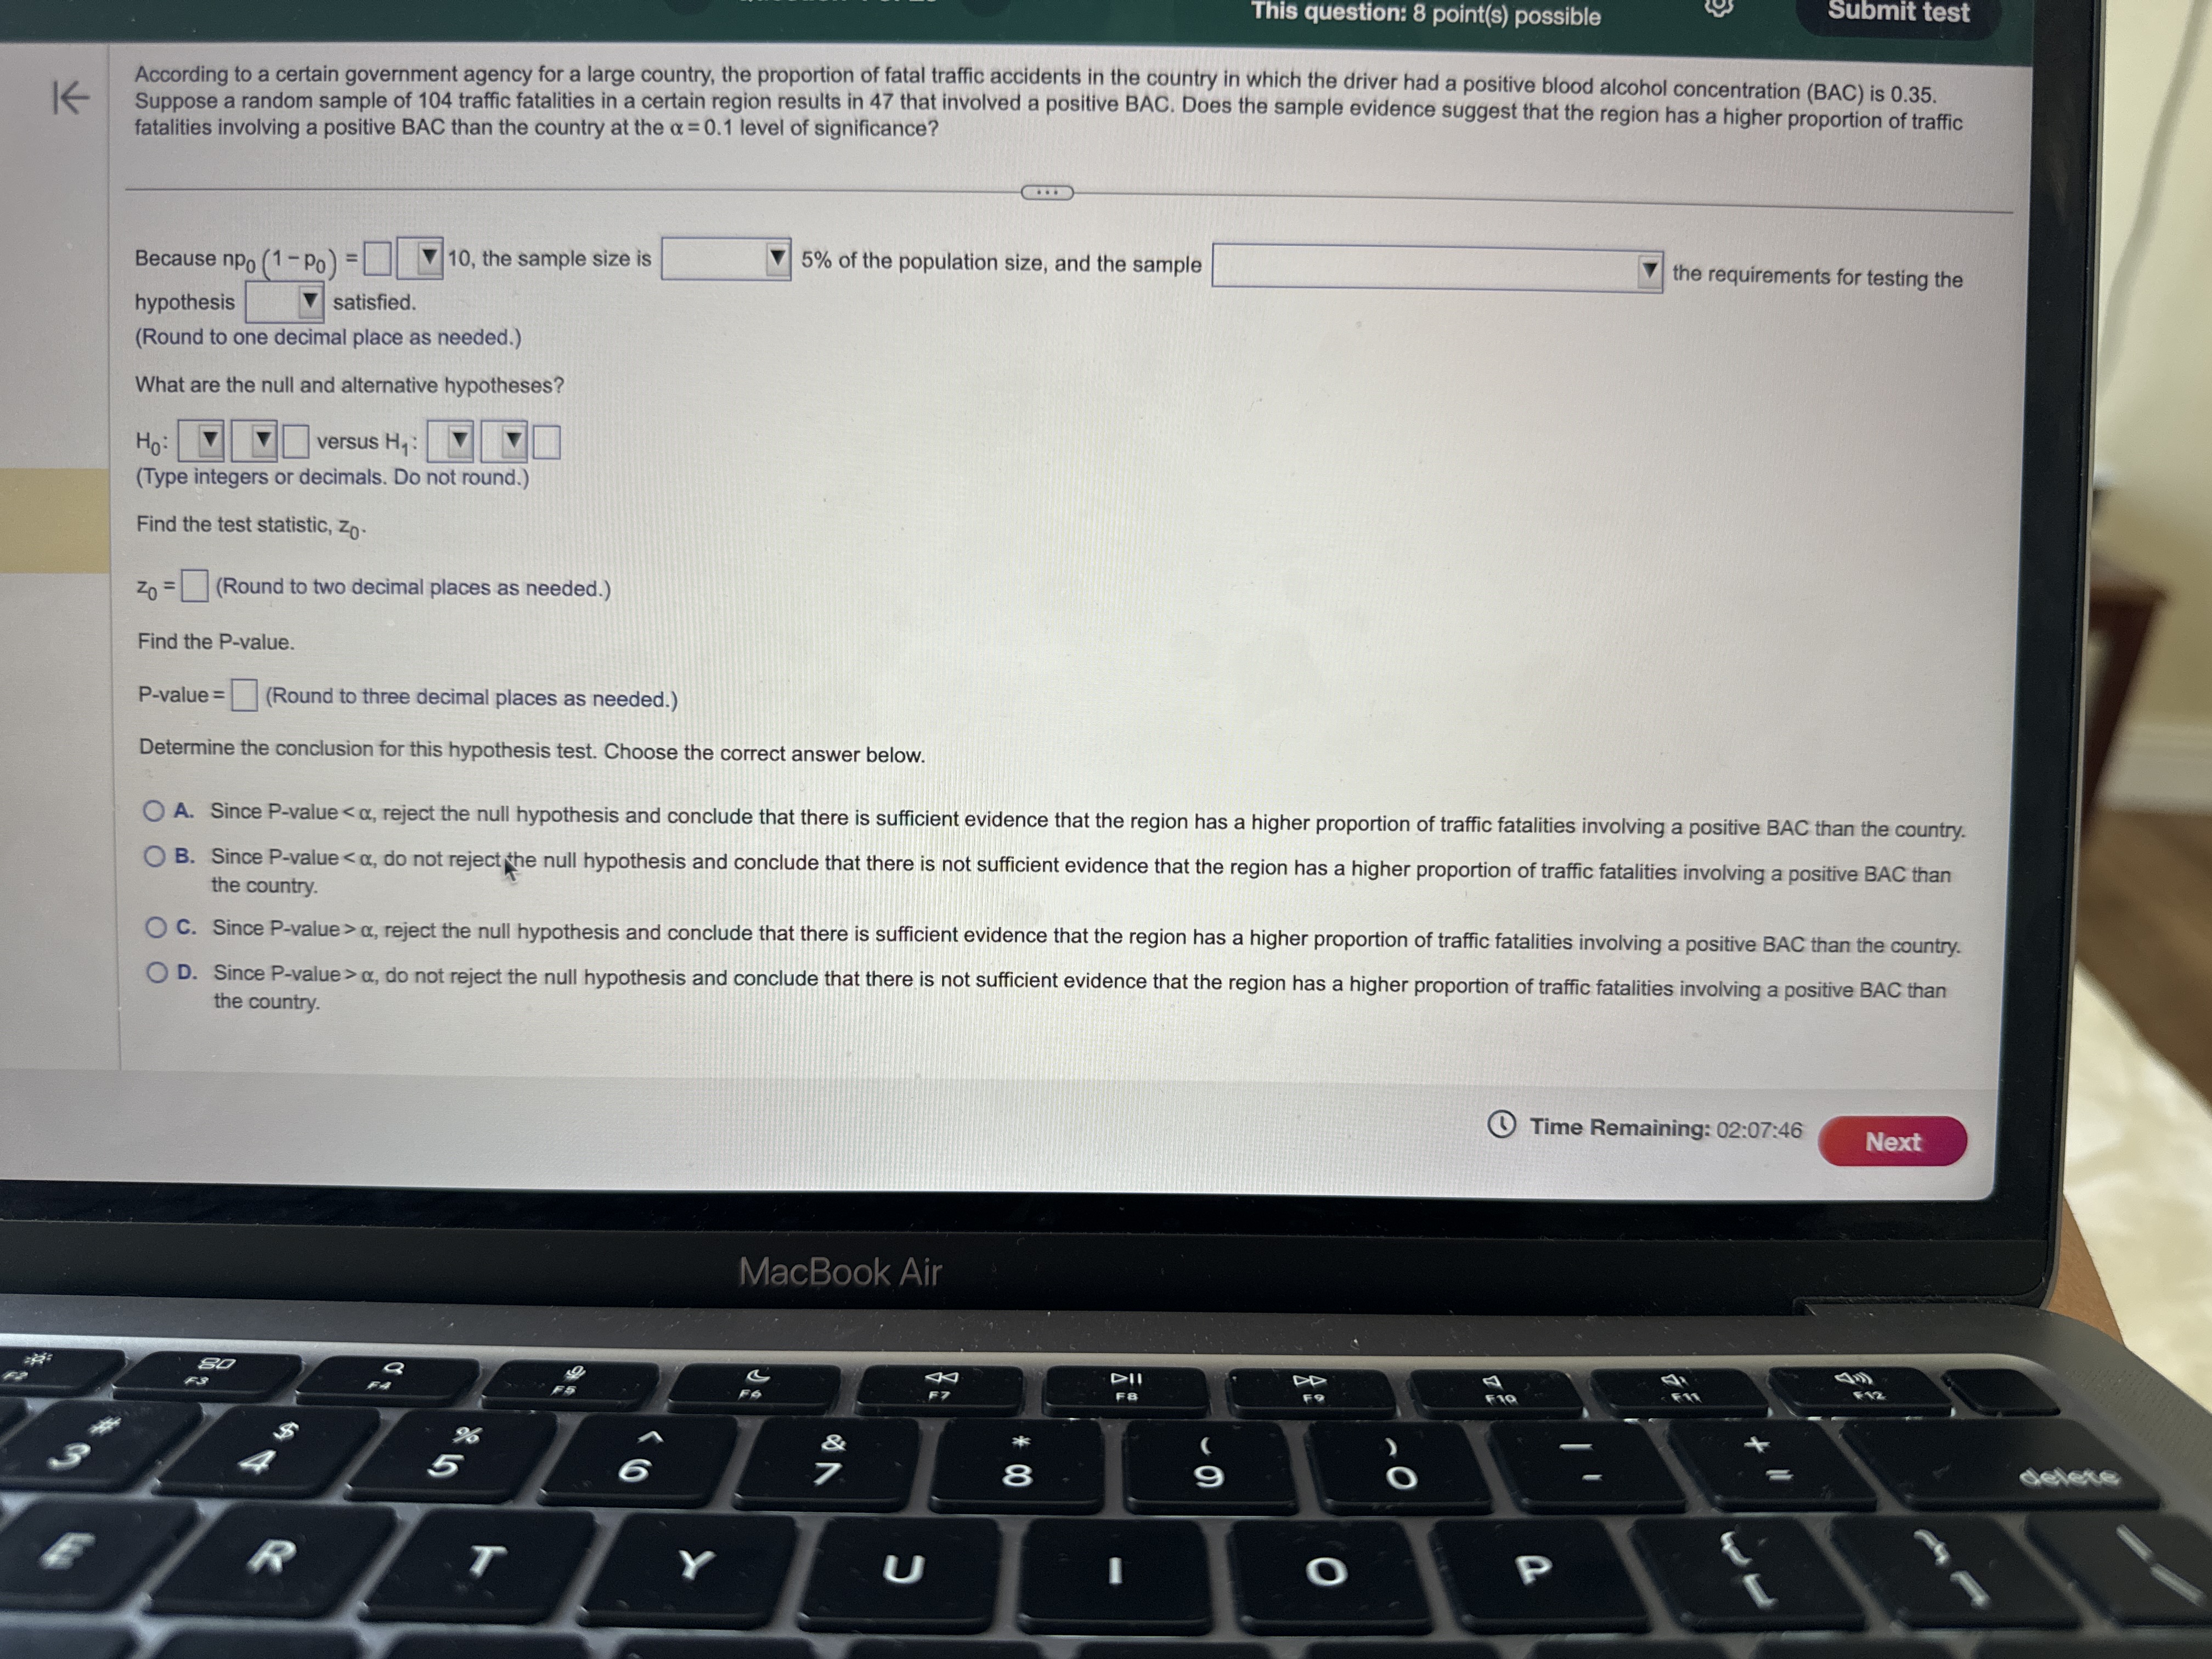
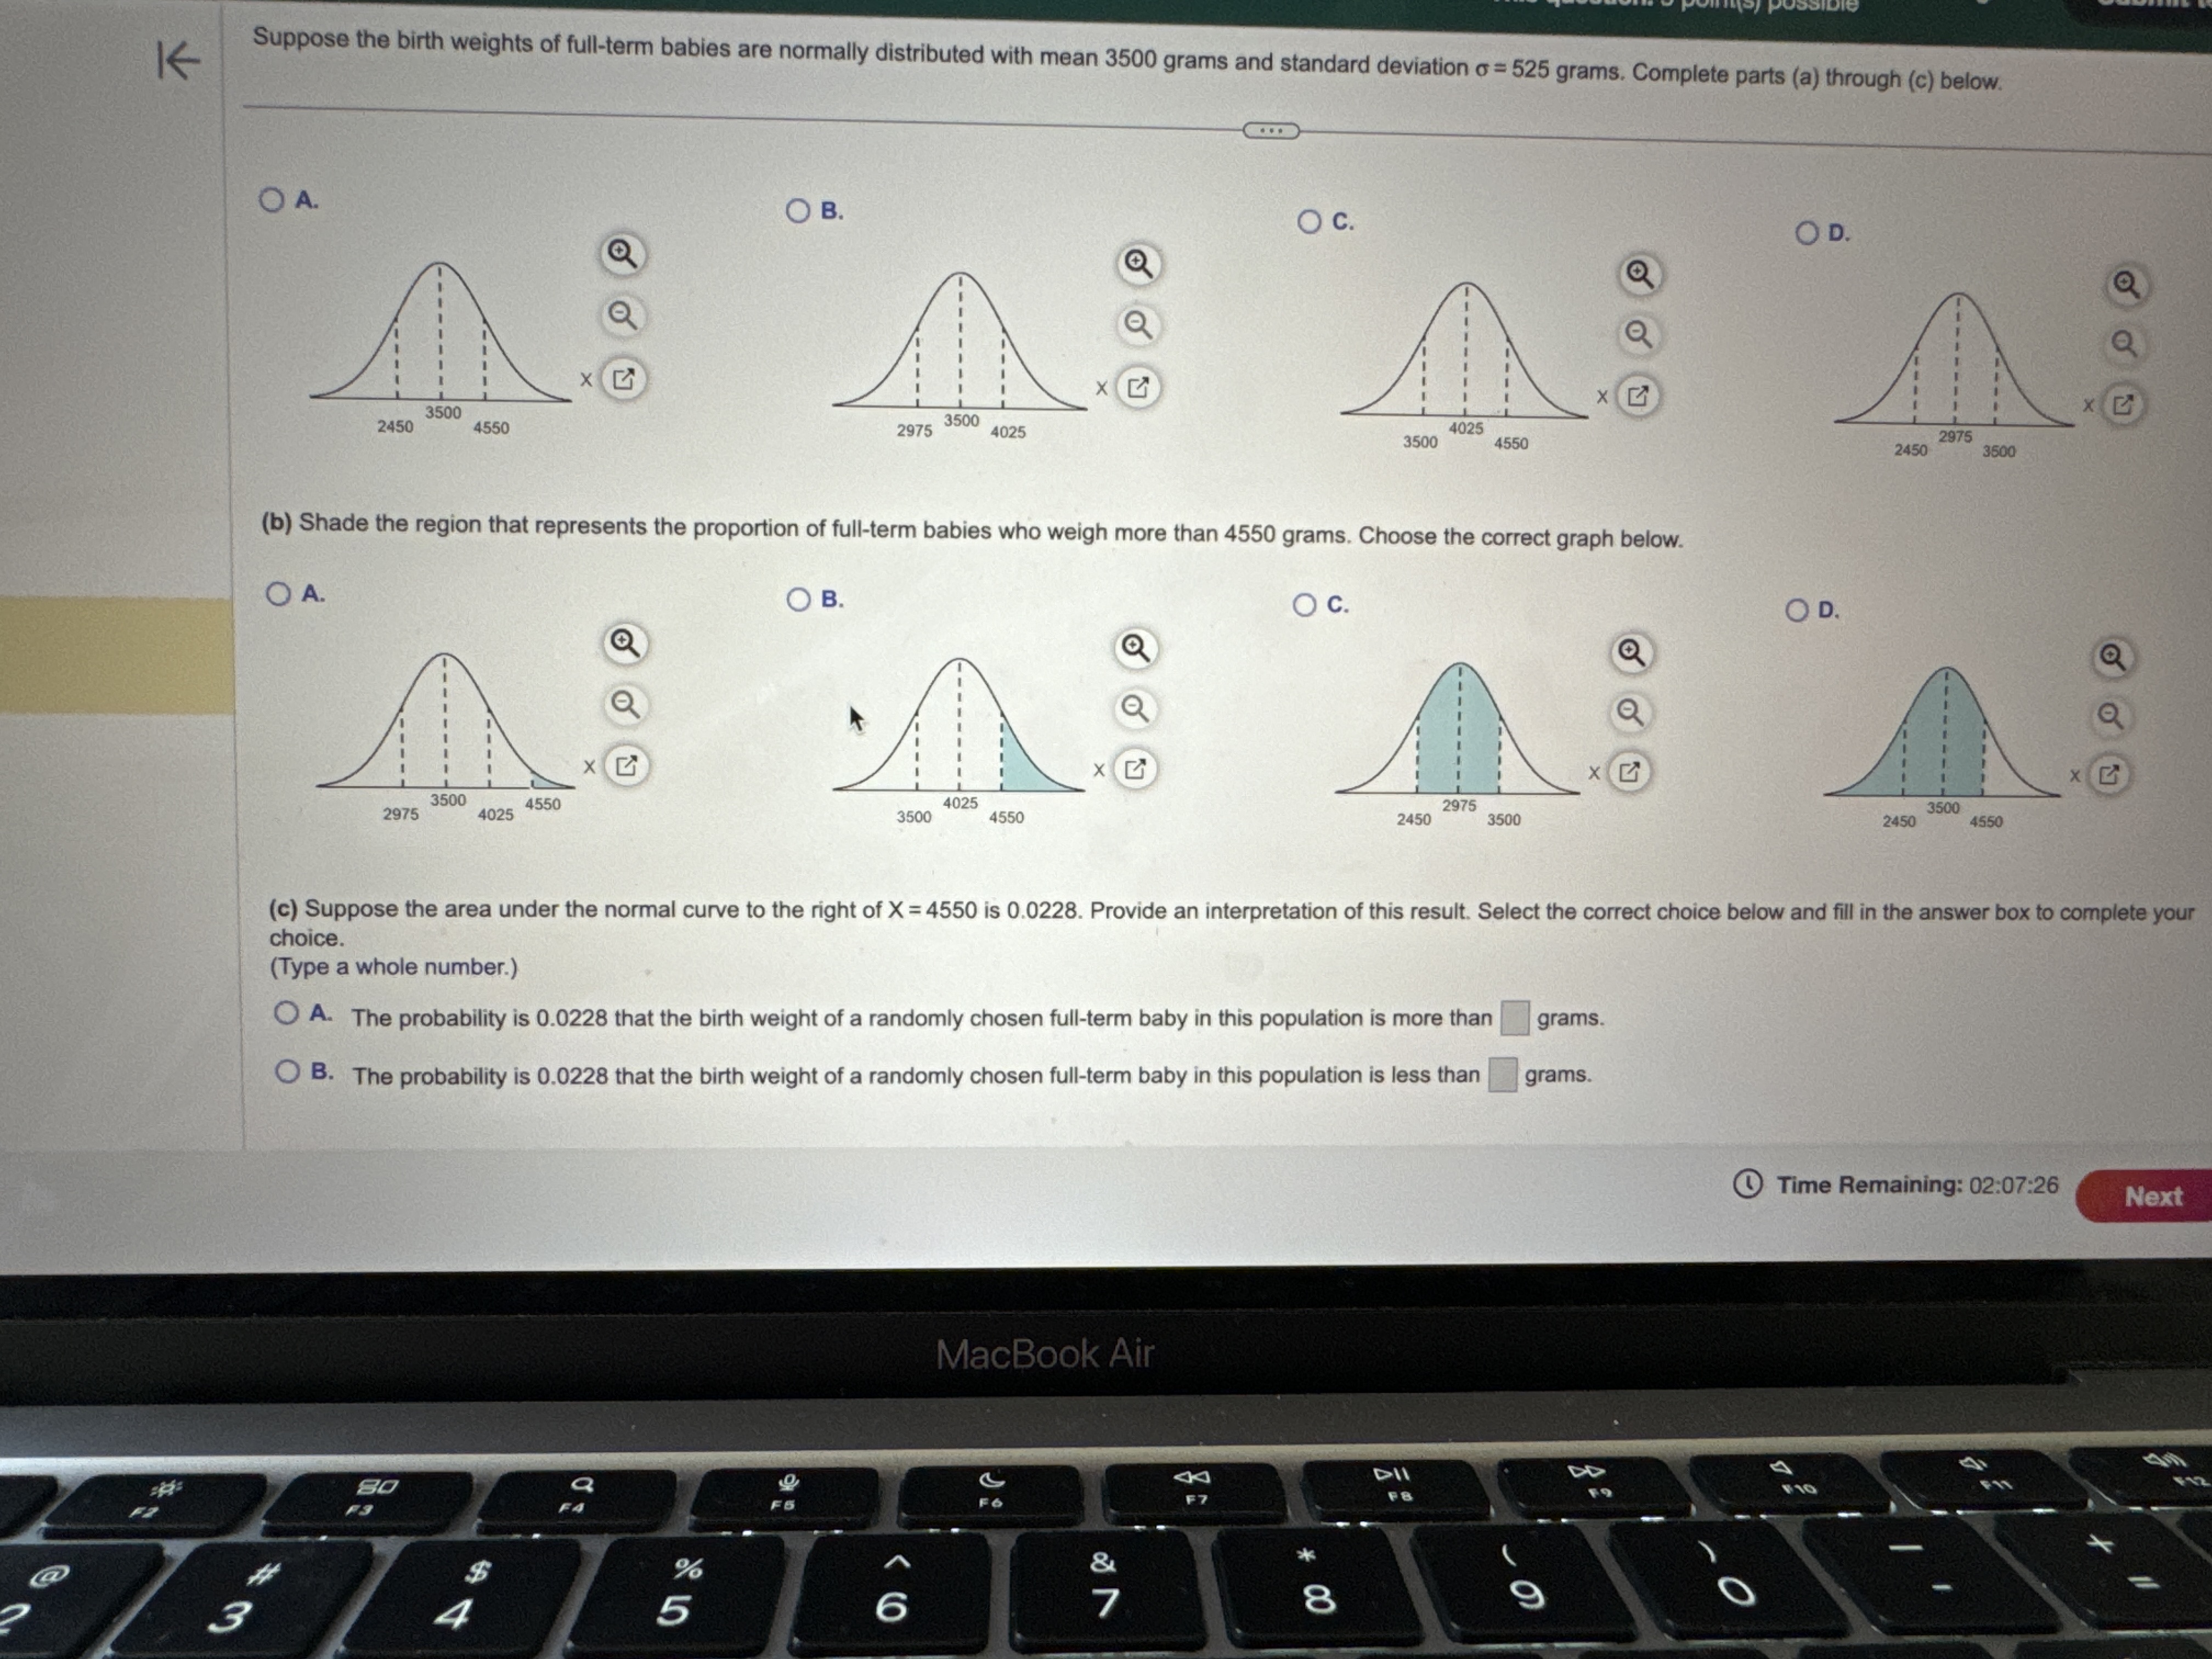
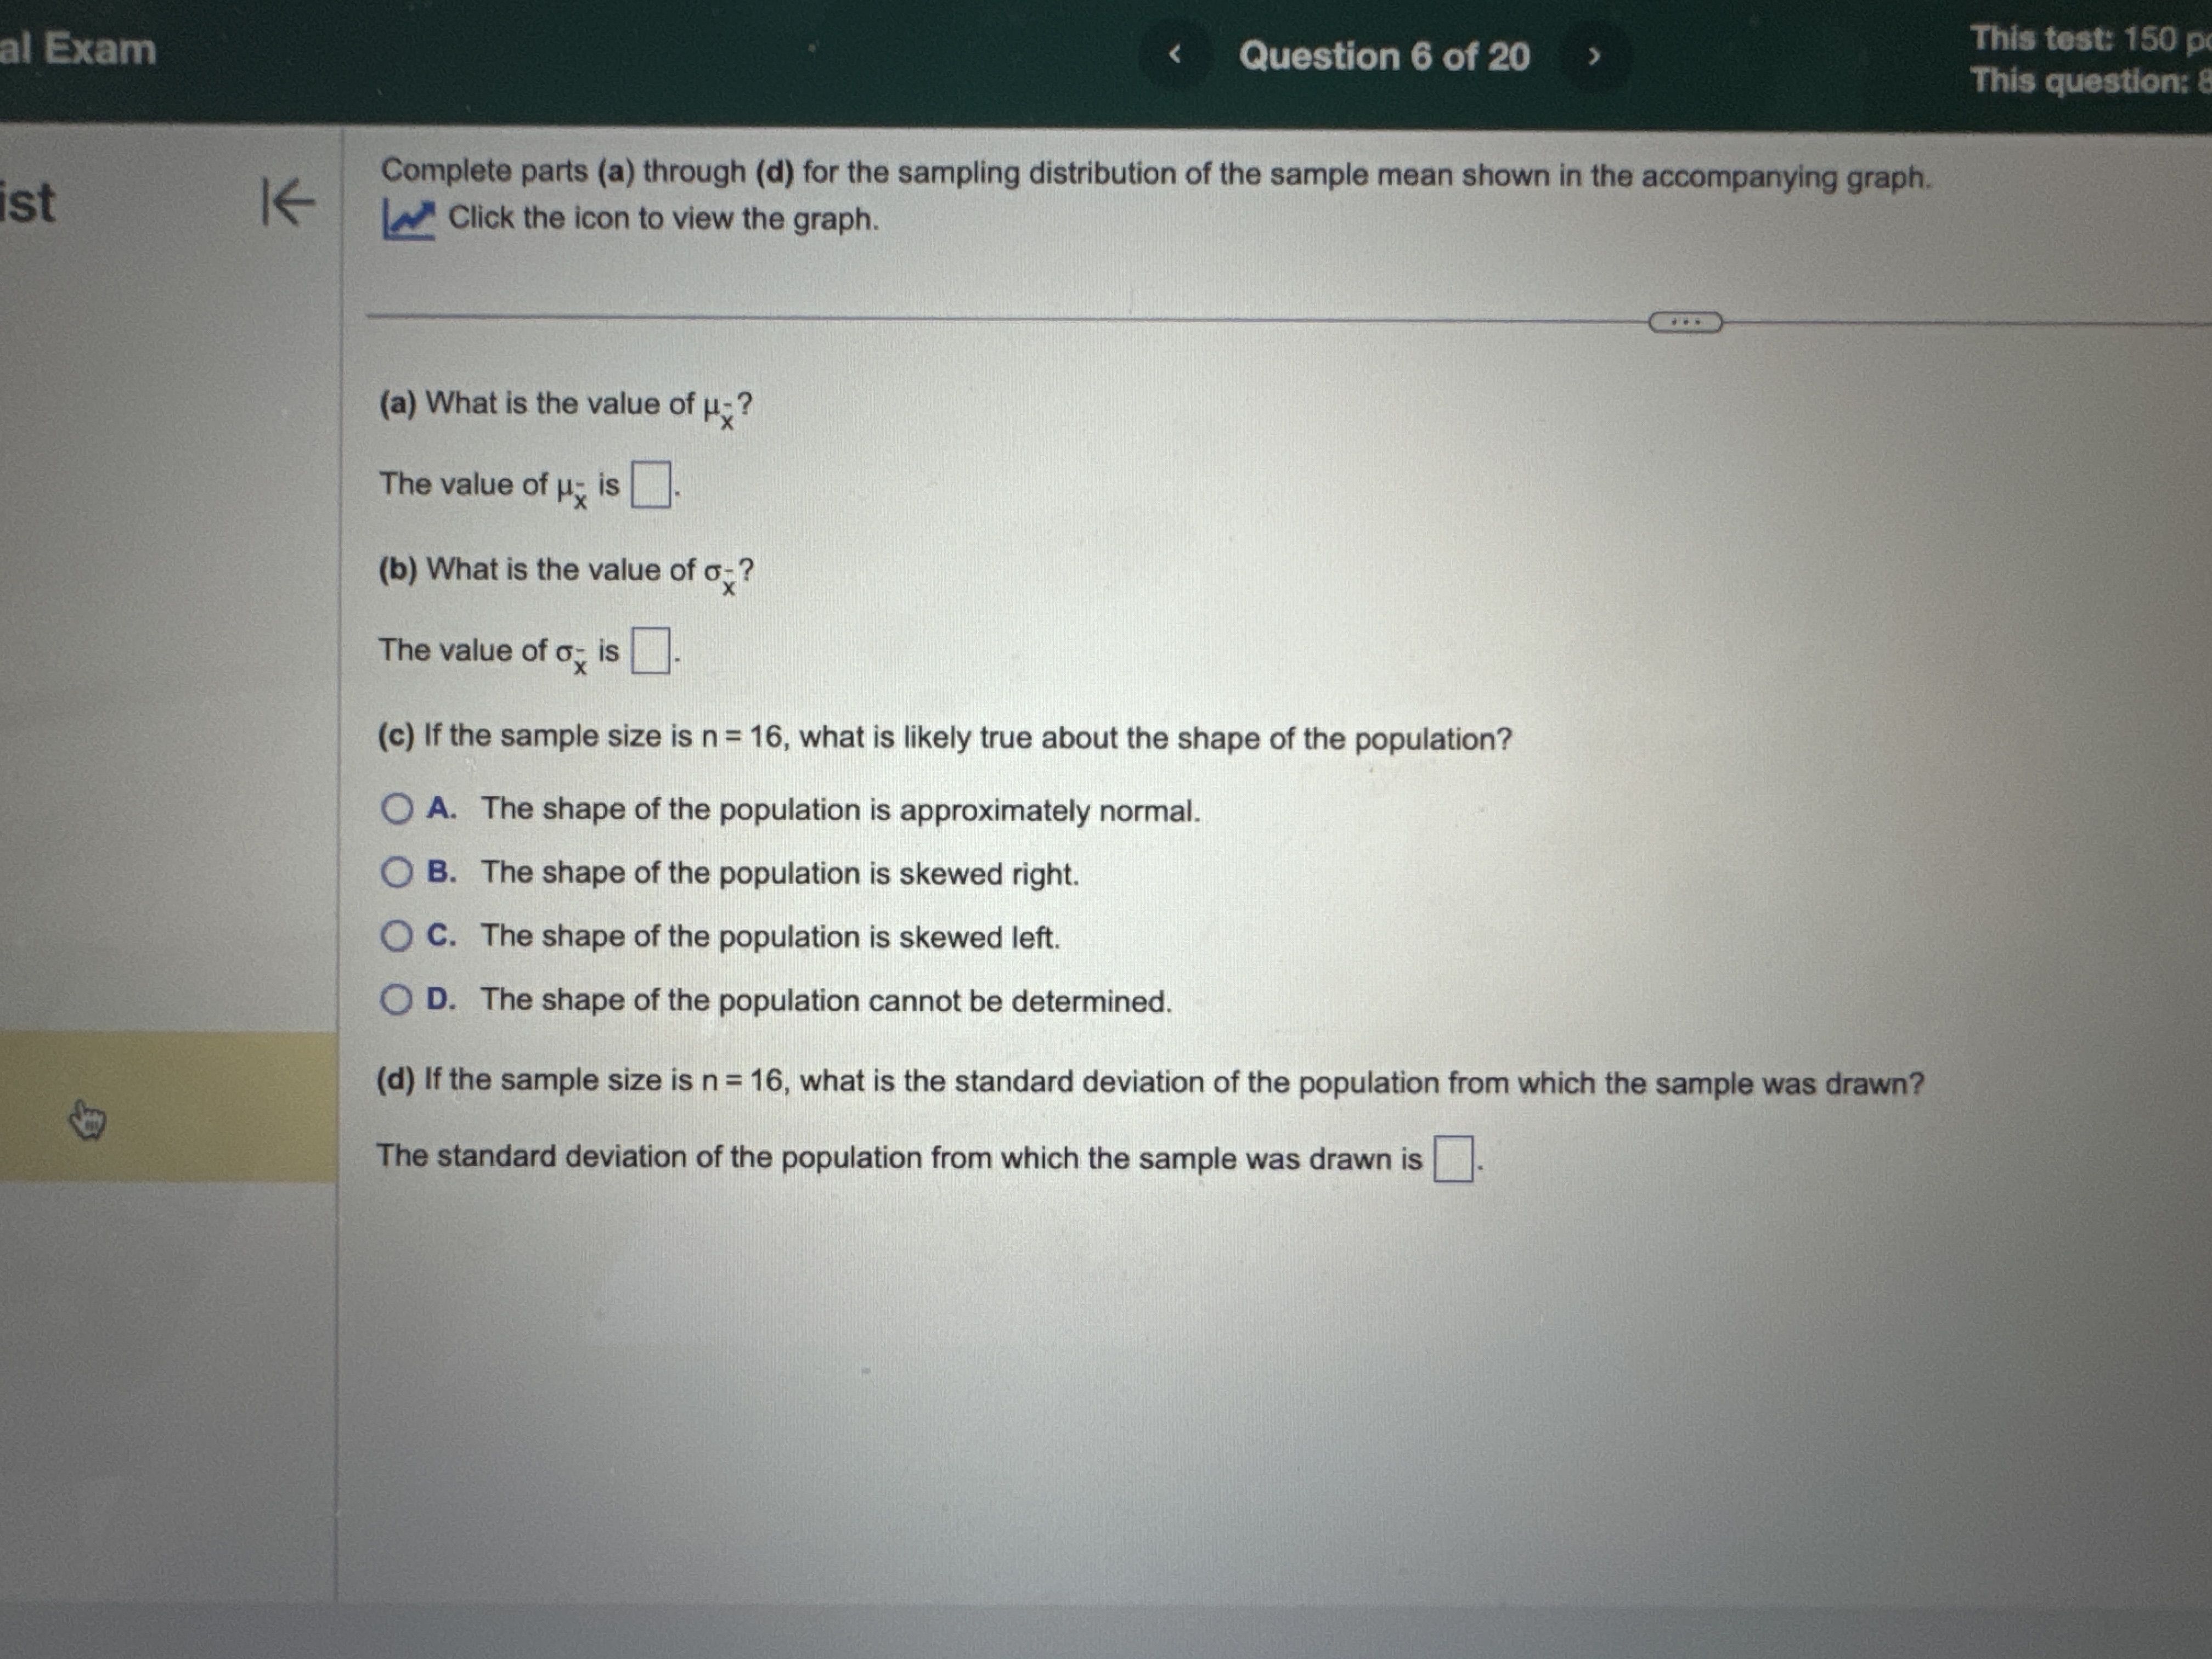
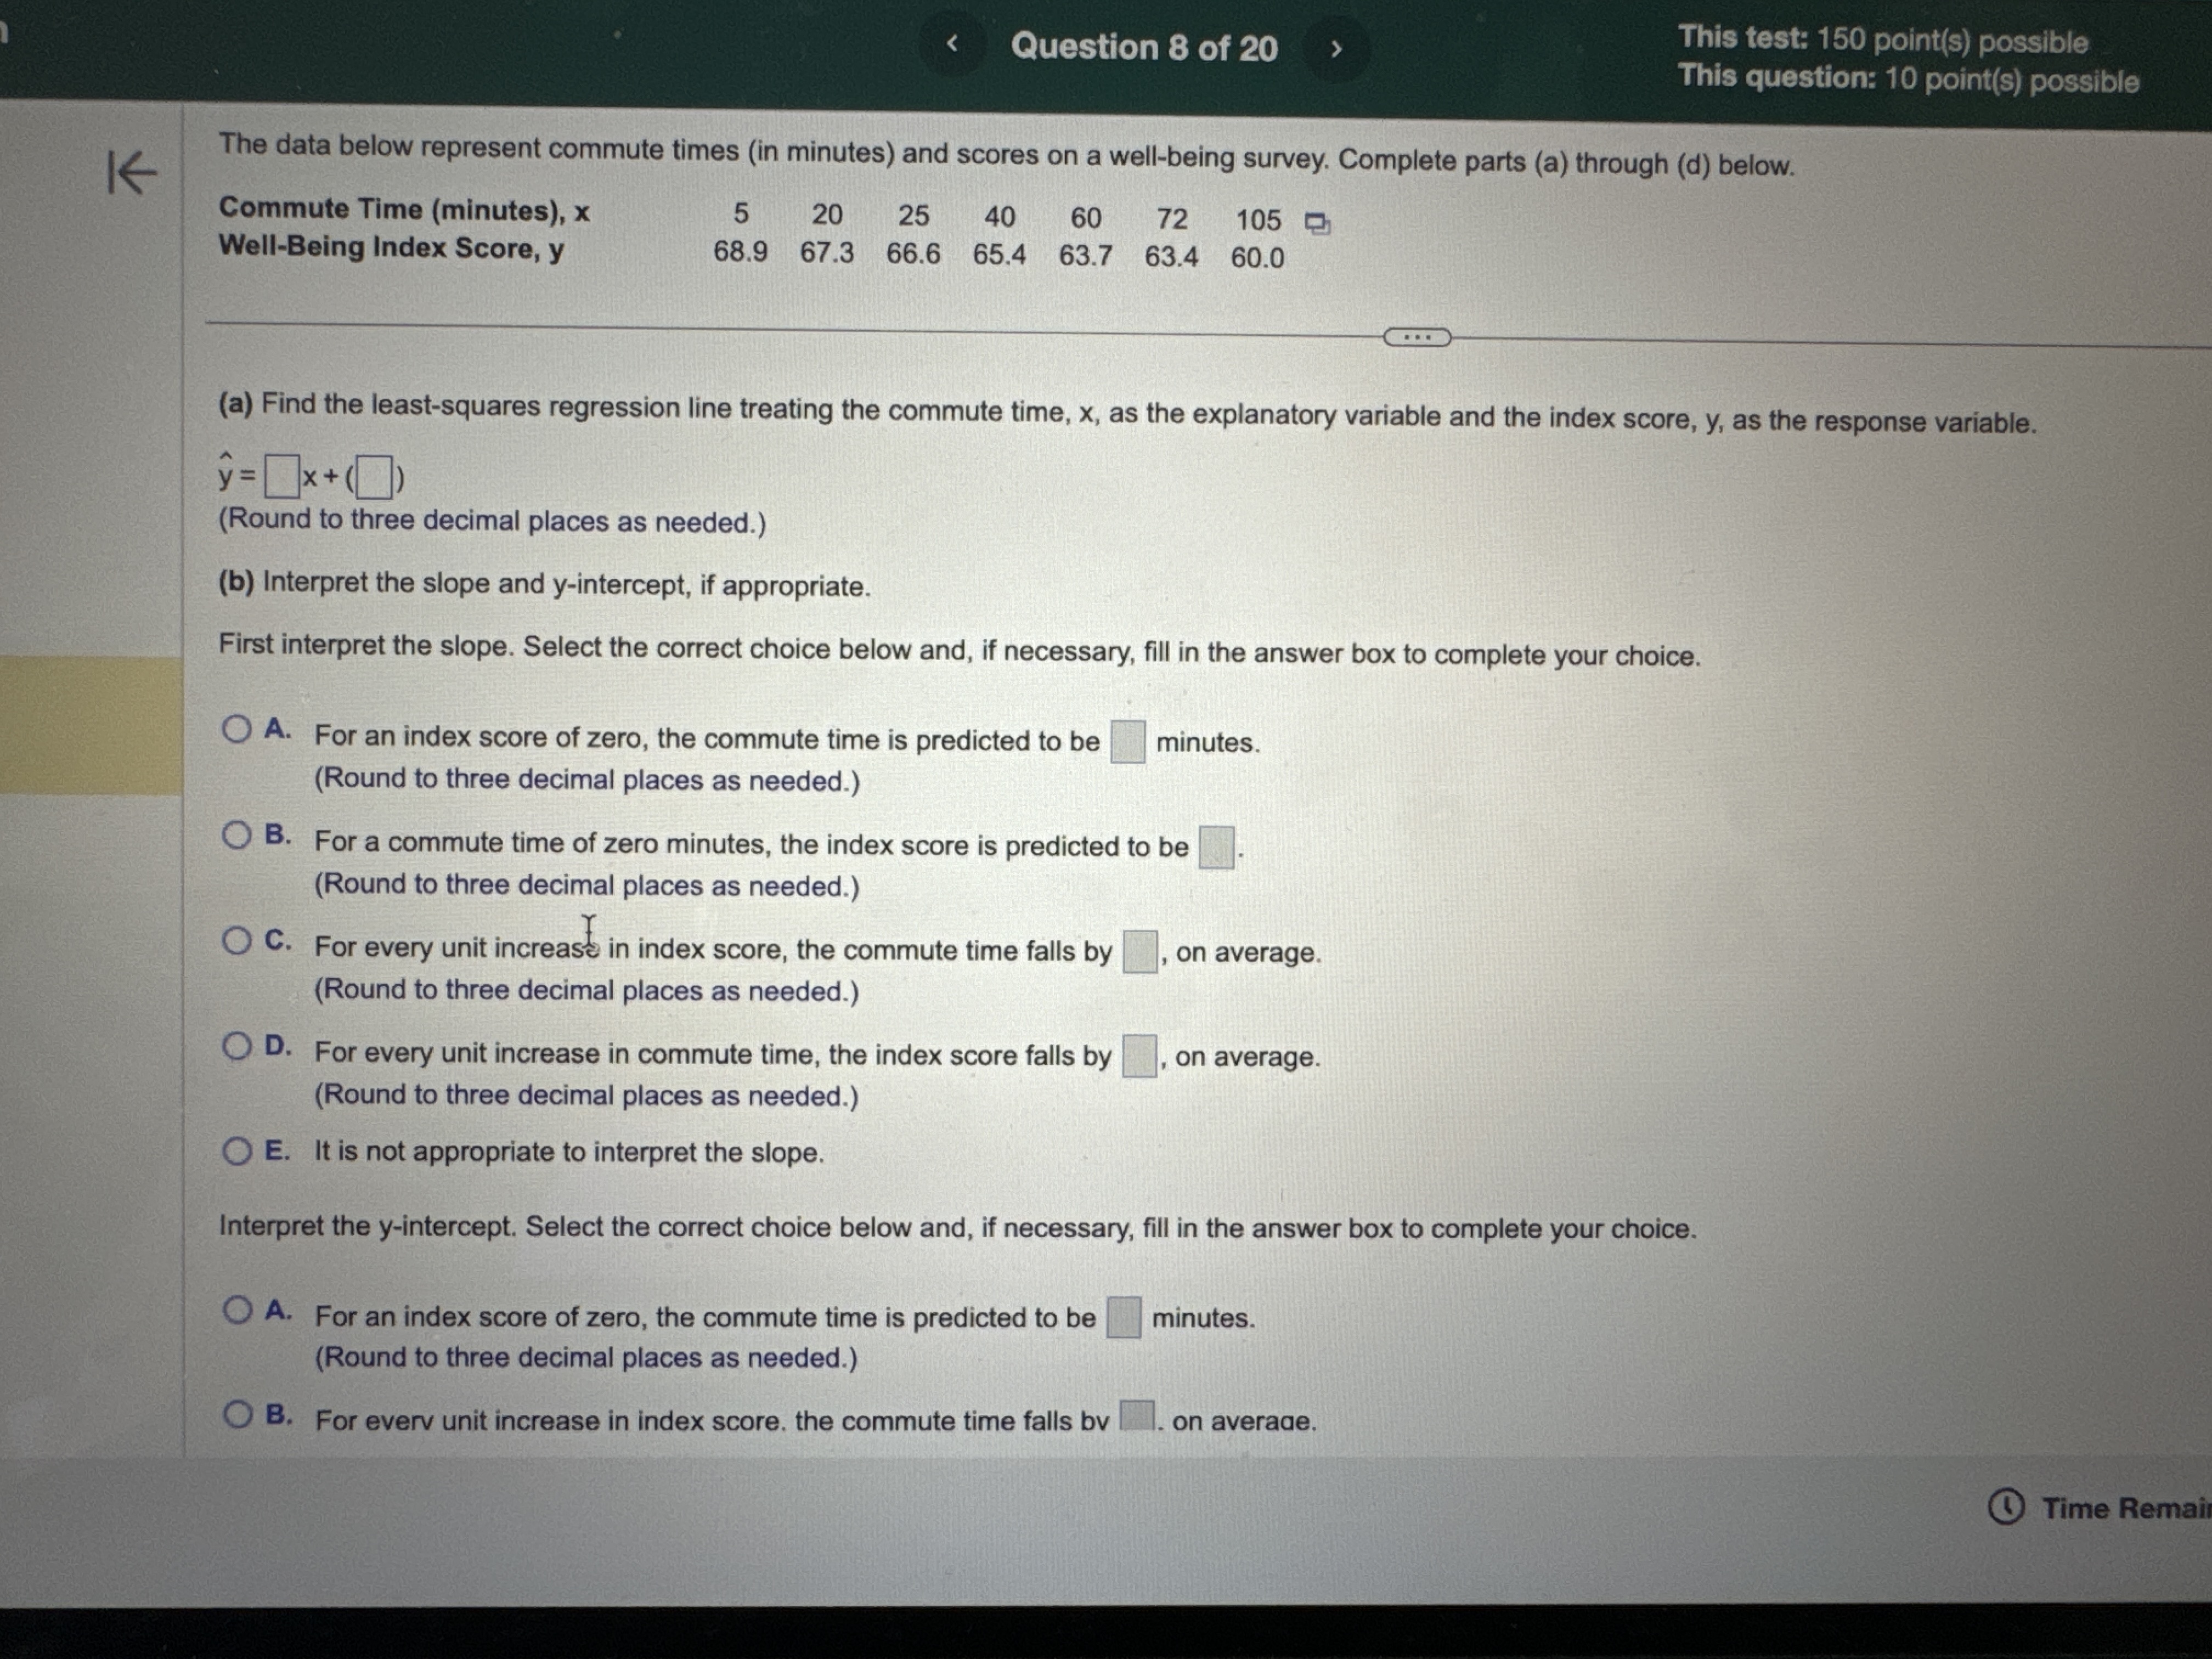

= This test: 150 point(s) possible p ELL L LR This question: 8 point(s) possible @ S LU L According to flightstats.com, American Airfines fli (a) Explain why this is a binomial experiment (b) Determine the values of n and p. () Find and interpret the probability that exactly 6 flights are on time (d) Find and Interpret the probability that at least 6 flights are on time. ights from Dallas to Chicago are on time 80% of the time. Suppose 10 flights are randomly selected, and the number of on-time flights is recorded. i (a) Identify the statements that explain why this is a binomial experiment. Select all that apply. | [J A. The experiment is performed until a desired number of successes are reached [ B. The trials are independent [ C. The experiment is performed a fixed number of times [ D. There are two mutually exclusive outcomes, success or failure JE The probability of success is different for each trial of the experiment [JF. Eachtrial depends on the previous trial [JG. The probability of success is the same for each trial of the experiment [J H. There are three mutually exclusive possible outcomes, arriving on-time, arriving early, and arriving late (b) Using the binomial distribution, determine the values of n and p. n= [: (Type an integer or a decimal. Do not round ) p= E (Type an integer or a decimal. Do not round ) (c) Using the binomial distribution, the probability that exactly 6 flights are on time is | (Round to four decimal places as needed ) Interpret the probability. In 100 trials of this experiment, it is expected that about | 7\\ will result in exactly 6 flights being on time 0 . - _ o B This question: 8 point(s) po ding to flightstats.com, American Airlines flights from Dallas to Chicago are on time 80% of the time. Su 10 flights are randomly selected, and ;%vb why this is a binomial experiment. Ppos % ! the values of n and p. Find and interpret the probability that exactly 6 flights are on time. ) Find and interpret the probability that at least 6 flights are on time. Each tnal depends on the previous tnal. D G. The probability of success is the same for each trial of the experiment. H. There are three mutually exclusive possible outcomes, arriving on-time, arriving early, and arriving late. (b) Using the binomial distribution, determine the values of n and p n= |:| (Type an integer or a decimal. Do not round.) p= D (Type an integer or a decimal. Do not round.) (c) Using the binomial distribution, the probability that exactly 6 flights are on time is J (Round to four decimal places as needed.) Interpret the probability. In 100 trials of this experiment, it is expected that about LJ will result in exactly 6 flights being on time. (Round to the nearest whole number as needed.) (d) Using the binomial distribution, the probability that at least 6 flights are on time is D (Round to four decimal places as needed.) _ Interpret the probability. In 100 trials of this experiment, it is expected that about D will result in at least 6 flights being on time (Round to the nearest whole number as needed.) t: Final Exam R T KL 7 This test: 150 point(s) possible @ This question: 8 point(s) possible R 5 % It has long been stated that the mean temperature of humans is 98.6F. However, two researchers currently involved in the subject thought that the mean temperature of humans is less than 98.6F. 3_'.' non '|St |e They measured the temperatures of 50 healthy adults 1 to 4 times daily for 3 days, obtaining 225 measurements. The sample data resulted in a sample mean of 98.4F and a sample standard deviation of 1F. Use the P-value approach to conduct a hypothesis test to judge whether the mean temperature of humans is less than 98.6F at the a =0.01 level of significance. ton 1 _ State the hypotheses Ho: | ||| |Vv|98.6F Hy:| V|| v|986F Find the test statistic : = (Round to two decimal places as needed.) X Jsestion 4 S The P-value is | (Round to three decimal places as needed.) uestion 5 What can be concluded O A. Reject H, since the P-value is not less than the significance level Semes 2 SR luestion 6 O B. Do not reject H, since the P-value is less than the significance level O C. Do not reject H, since the P-value is not less than the significance level fon 7 O D. Reject H, since the P-value is less than the significance level Question 8 Question 9 @ Time Remaining: 02:08:02 L T e ubmit test | According to a certain government agency for a large country, the proportion of fatal traffic accidents in the country in which the driver had a positive blood alcohol concentration (BAC) is 0.35. Suppose a random sample of 104 traffic fatalities in a certain region results in 47 that involved a positive BAC. Does the sample evidence suggest that the region has a higher proportion of traffic fatalities involving a positive BAC than the country at the a = 0.1 level of significance? e i i il Because np, (1- po) = Y110, the sample size is Y| 5% of the population size, and the sample / the requirements for testing the hypothesis V| satisfied. (Round to one decimal place as needed.) What are the null and alternative hypotheses? { { | Hp: V] Vl versus Hy: V| vl ] (Type integers or decimals. Do not round.) Find the test statistic, z;,. zy=| | (Round to two decimal places as needed.) Find the P-value. P-value = (Round to three decimal places as needed.) Determine the conclusion for this hypothesis test. Choose the correct answer below. O A. Since P-valueq, reject the null hypothesis and conclude that there is sufficient evidence that the region has a higher proportion of traffic fatalities involving a positive BAC than the country. O D. Since P-value> g, do not reject the null hypothesis and conclude that there is not sufficient evidence that the region has a higher proportion of traffic fatalities involving a positive BAC than the country. Time Remaining: 02:07:46 m (LU U 2975 v 4025 (b) Shade the region that represents the proportion of full-term babies who weigh more than 4550 grams OA Choose the correct graph below. OB. O C Q Q x\\Z 3500 2075 4025 4% (c) Suppose the area under the normal curve to the right of X = 4550 is 0.0228. Provide an interpretation of this result. Select the correct choice below and fill choice. inthe (Type a whole number.) OA The probability is 0.0228 that the birth weight of a randomly chosen full-term baby in this population is more than j grams. O B. The probability is 0.0228 that the birth weight of a randomly chosen full-term baby in this population is less than D grams. al Exam Question 6 of 20 This test: 150 This question: Complete parts (a) through (d) for the sampling distribution of the sample mean shown in the accompanying graph. ist K Click the icon to view the graph. (a) What is the value of ux? The value of My is (b) What is the value of ox? The value of o is (c) If the sample size is n = 16, what is likely true about the shape of the population? A. The shape of the population is approximately normal. O B. The shape of the population is skewed right. O C. The shape of the population is skewed left. O D. The shape of the population cannot be determined. (d) If the sample size is n = 16, what is the standard deviation of the population from which the sample was drawn? The standard deviation of the population from which the sample was drawn isQuestion 8 of 20 This test: 150 point(s) possible This question: 10 point(s) possible K The data below represent commute times (in minutes) and scores on a well-being survey. Complete parts (a) through (d) below. Commute Time (minutes), x 5 20 25 40 60 72 105 Well-Being Index Score, y 68.9 67.3 66.6 65.4 63.7 63.4 60.0 (a) Find the least-squares regression line treating the commute time, x, as the explanatory variable and the index score, y, as the response variable. y = [ * + 0) (Round to three decimal places as needed.) (b) Interpret the slope and y-intercept, if appropriate. First interpret the slope. Select the correct choice below and, if necessary, fill in the answer box to complete your choice. A. For an index score of zero, the commute time is predicted to be minutes. (Round to three decimal places as needed.) O B. For a commute time of zero minutes, the index score is predicted to be (Round to three decimal places as needed.) O C. For every unit increase in index score, the commute time falls by , on average. (Round to three decimal places as needed.) D. For every unit increase in commute time, the index score falls by , on average. (Round to three decimal places as needed.) O E. It is not appropriate to interpret the slope. Interpret the y-intercept. Select the correct choice below and, if necessary, fill in the answer box to complete your choice. A. For an index score of zero, the commute time is predicted to be minutes. (Round to three decimal places as needed.) O B. For every unit increase in index score. the commute time falls bv . on average. Time RemainThis question: 10 point(s) possible Submit test K The data below represent commute times (in minutes) and scores on a well-being survey. Complete parts (a) through (d) below. Commute Time (minutes), x 5 20 25 40 60 72 105 Well-Being Index Score, y 68.9 67.3 66.6 65.4 63.7 63.4 60.0 interpret ine y-intercept. Select ine correct choice below and, If necessary, Till In the answer pox to complete your choice. A. For an index score of zero, the commute time is predicted to be minutes. (Round to three decimal places as needed.) B. For every unit increase in index score, the commute time falls by , on average. (Round to three decimal places as needed.) C. For every unit increase in commute time, the index score falls by , on average. (Round to three decimal places as needed.) O D. For a commute time of zero minutes, the index score is predicted to be. (Round to three decimal places as needed.) O E. It is not appropriate to interpret the y-intercept because a commute time of zero minutes does not make sense and the value of zero minutes is much smaller than those observed in the data set (c) Predict the well-being index of a person whose commute time is 30 minutes. The predicted index score is (Round to one decimal place as needed.) (d) Suppose Barbara has a 15-minute commute and scores 67.0 on the survey. Is Barbara more "well-off" than the typical individual who has a 15-minute commute? Select the correct choice below and fill in the answer box to complete your choice. (Round to one decimal place as needed.) A. Yes, Barbara is more well-off because the typical individual who has a 15-minute commute scores O B. No, Barbara is less well-off because the typical individual who has a 15-minute commute scores Time Remaining: 02:06:12 Next MacBook Air DO 211 O 6 T U O P R Y
Step by Step Solution
There are 3 Steps involved in it

Get step-by-step solutions from verified subject matter experts