

Answered step by step
Verified Expert Solution
Question
1 Approved Answer
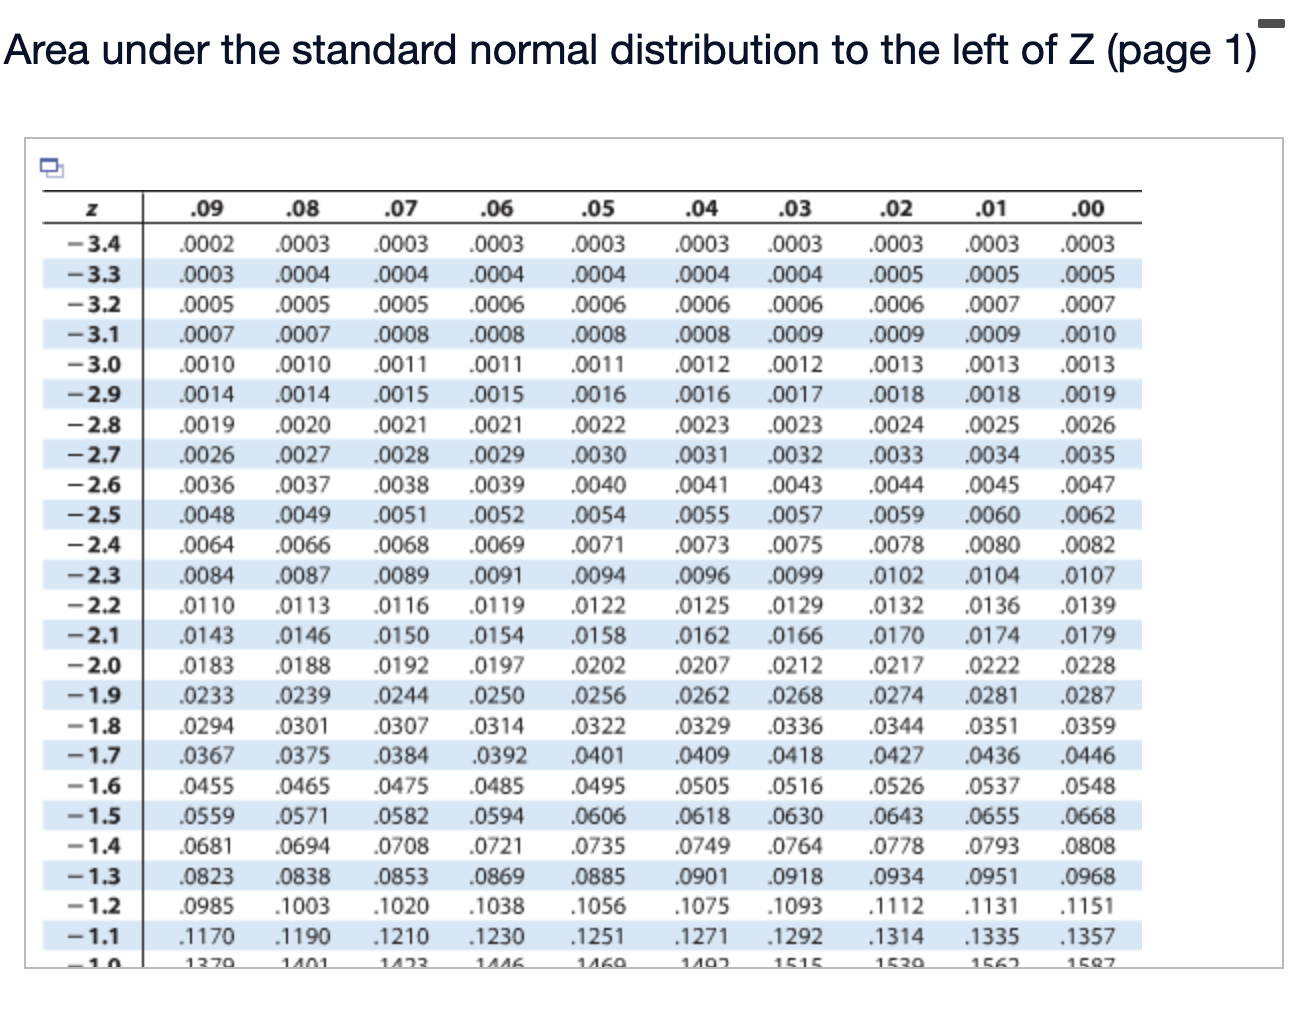
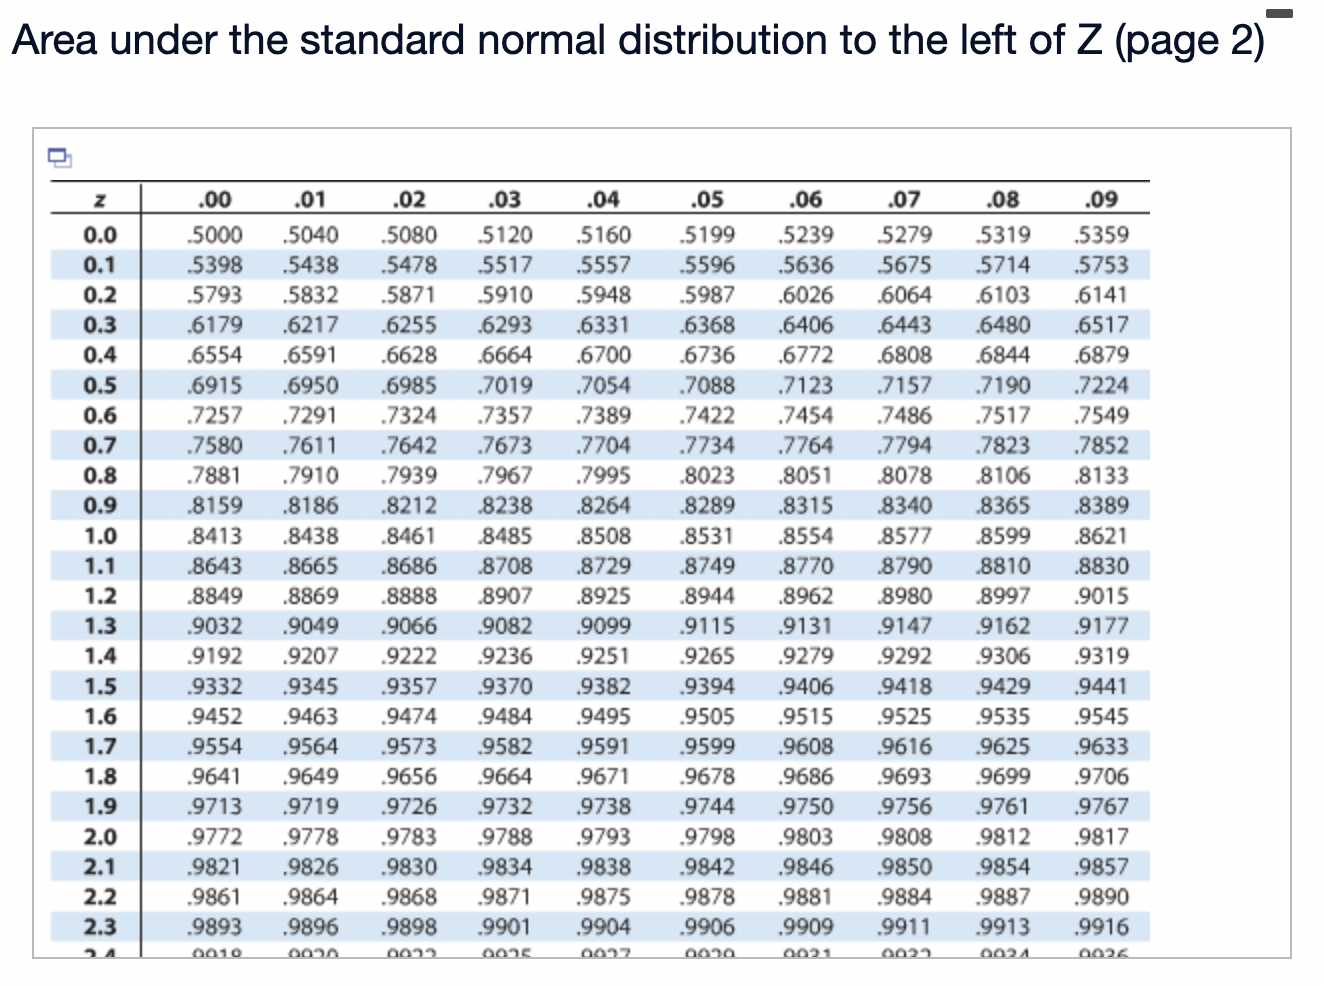
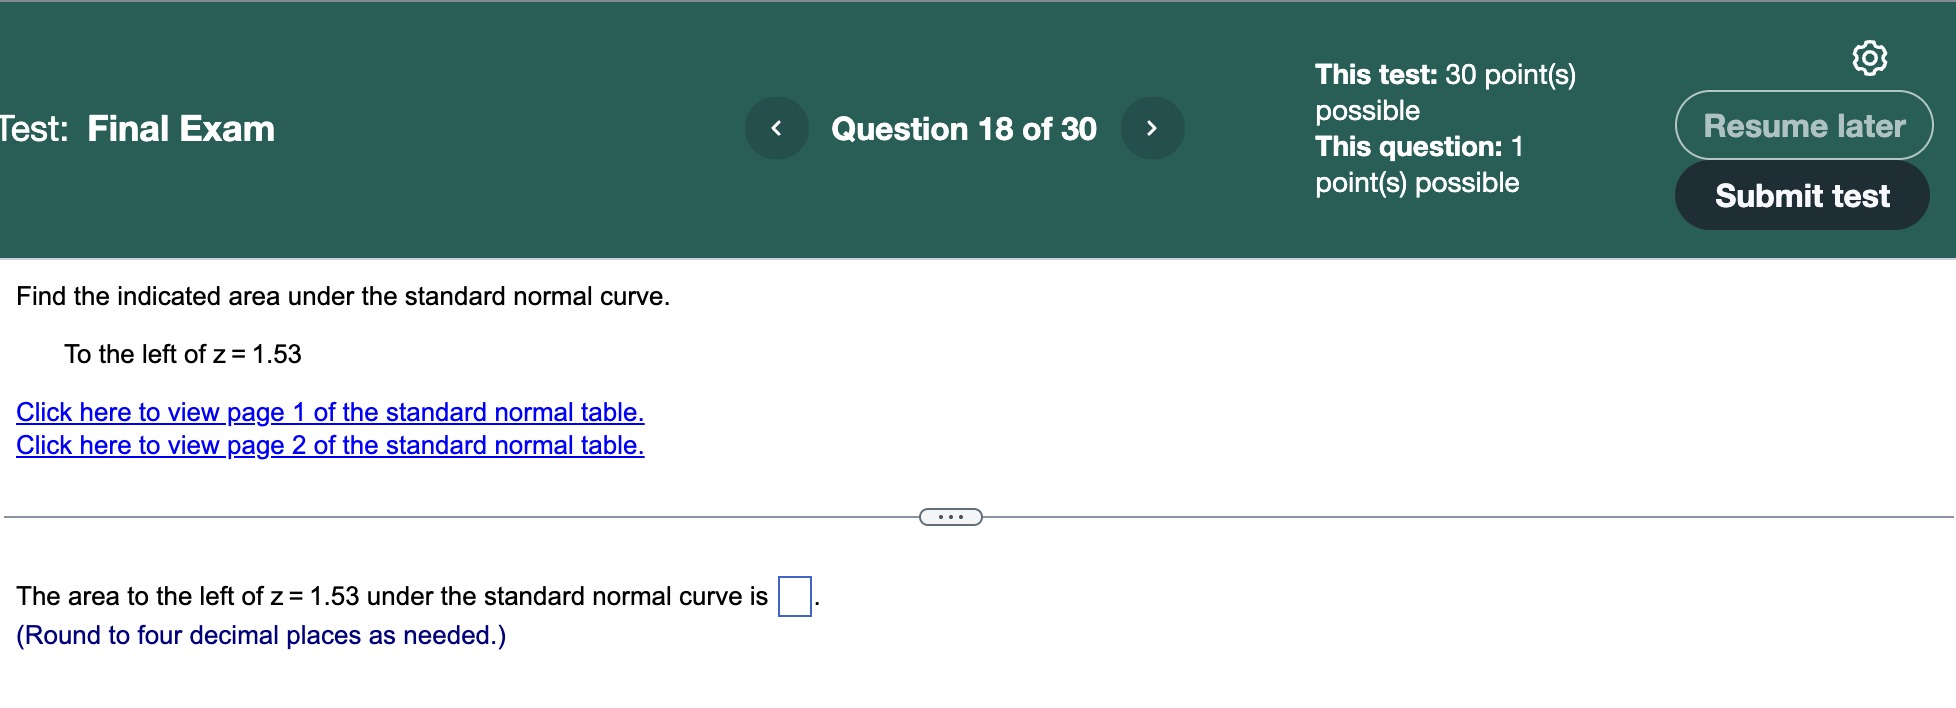
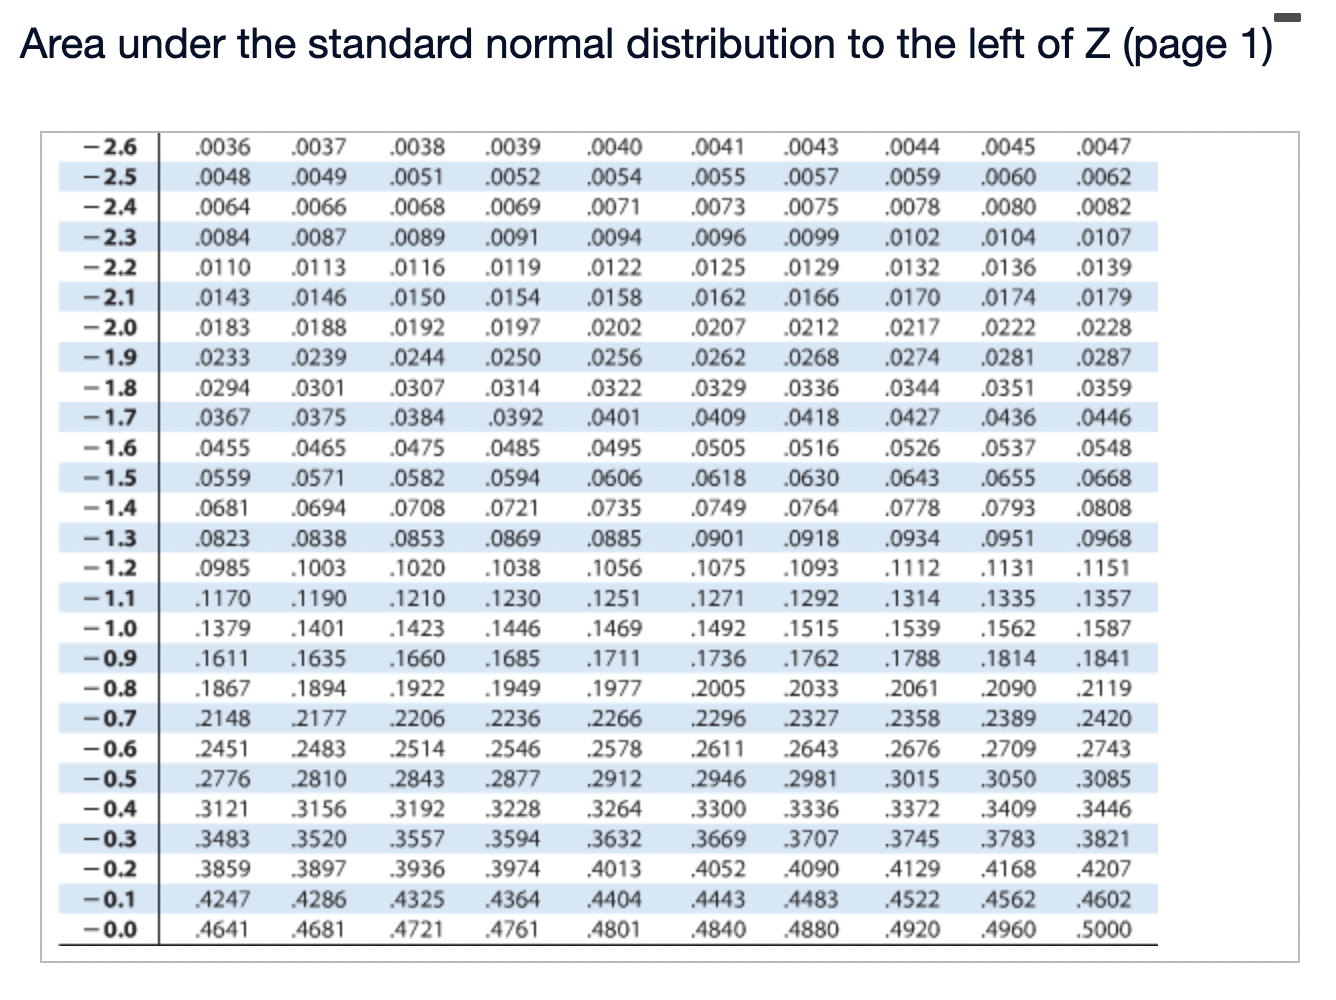
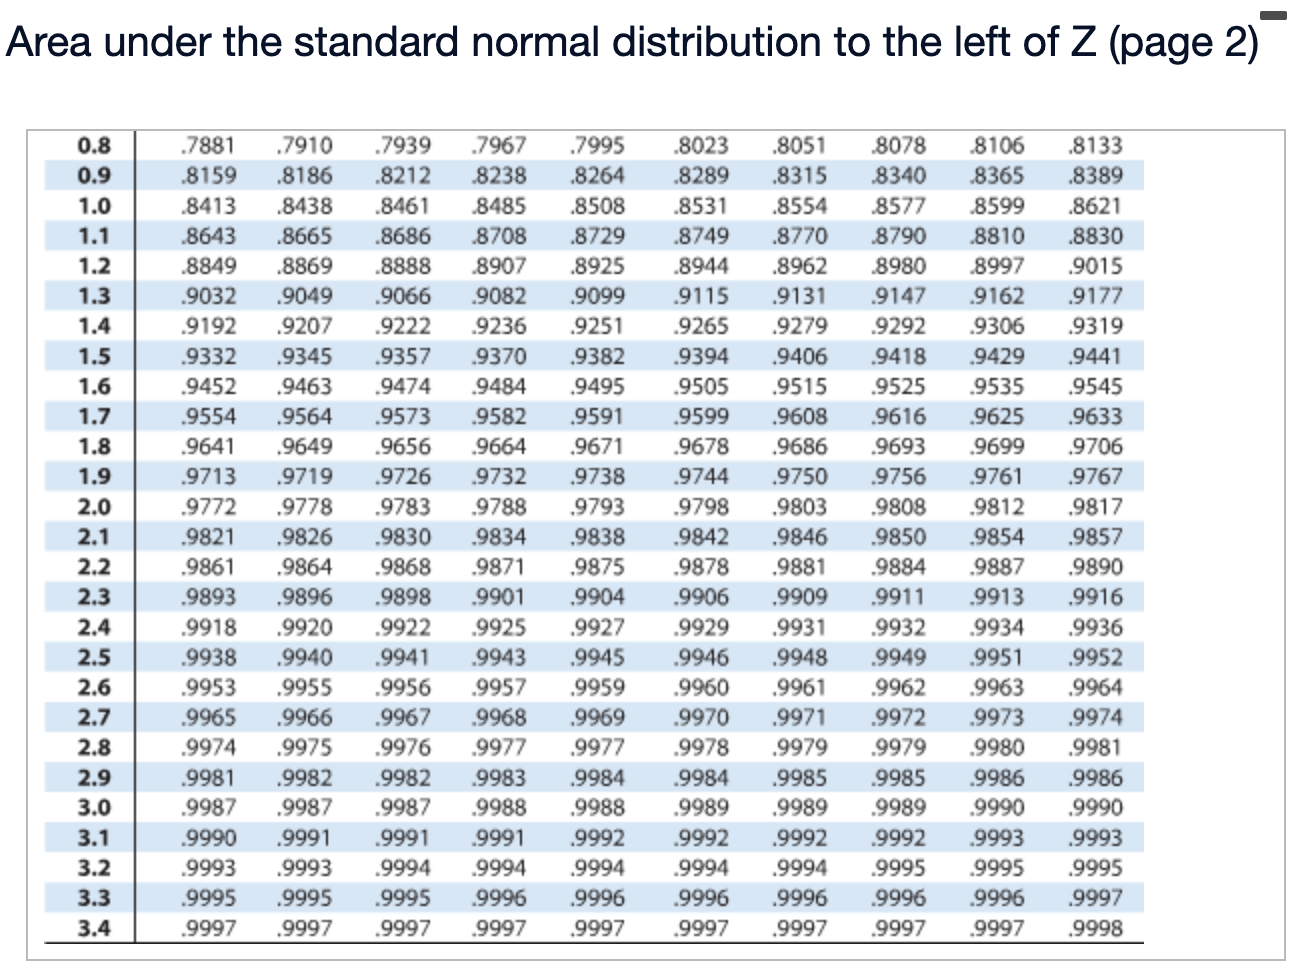
This test: 30 point(s) possible This question: 1 p0int(s) possible Submit test est: Final Exam Question 18 of 30 Find the indicated area under the


Step by Step Solution
There are 3 Steps involved in it
Step: 1

Get Instant Access to Expert-Tailored Solutions
See step-by-step solutions with expert insights and AI powered tools for academic success
Step: 2

Step: 3
Ace Your Homework with AI
Get the answers you need in no time with our AI-driven, step-by-step assistance
Get Started
Elementary Statistics Picturing The World
Authors: Ron Larson, Betsy Farber
6th Edition
0321911210, 978-0321911216