this us the table that should be used
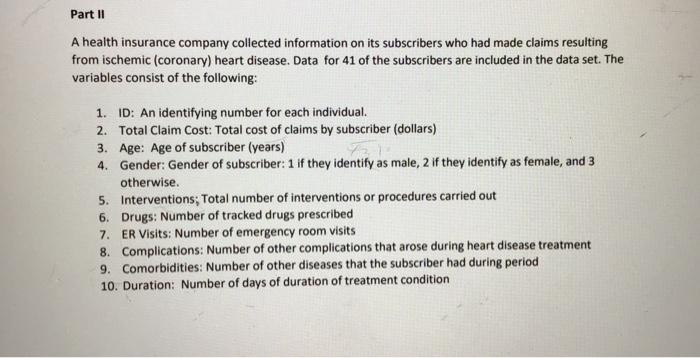
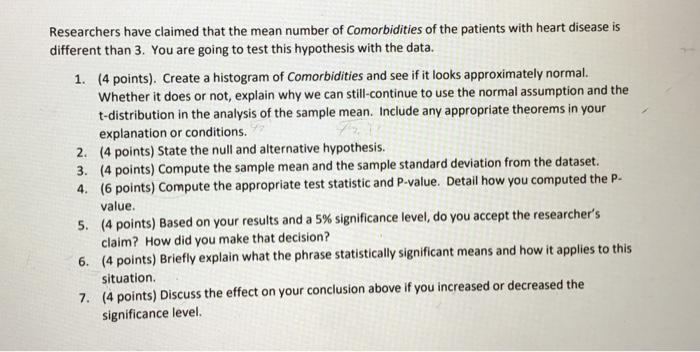
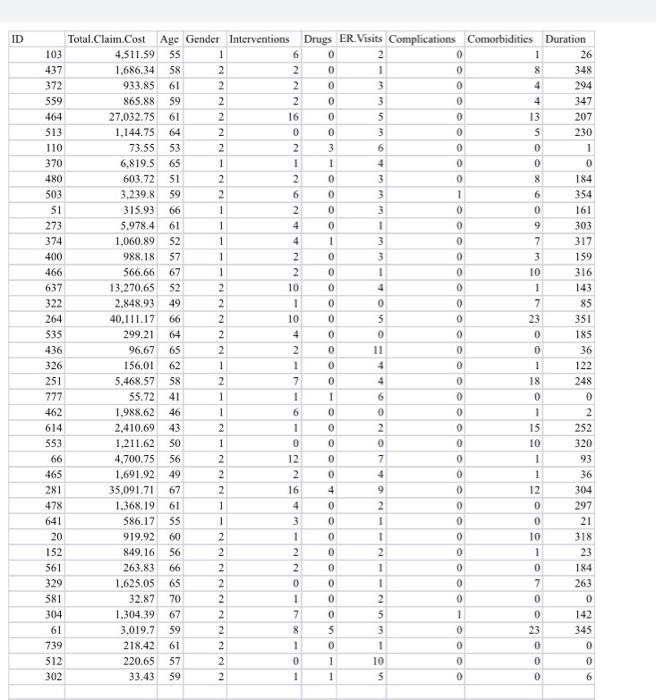
Part II A health insurance company collected information on its subscribers who had made claims resulting from ischemic (coronary) heart disease. Data for 41 of the subscribers are included in the data set. The variables consist of the following: 1. ID: An identifying number for each individual. 2. Total Claim Cost: Total cost of claims by subscriber dollars) 3. Age: Age of subscriber (years) 4. Gender: Gender of subscriber: 1 if they identify as male, 2 if they identify as female, and 3 otherwise. 5. Interventions, Total number of interventions or procedures carried out 6. Drugs: Number of tracked drugs prescribed 7. ER Visits: Number of emergency room visits 8. Complications: Number of other complications that arose during heart disease treatment 9. Comorbidities: Number of other diseases that the subscriber had during period 10. Duration: Number of days of duration of treatment condition Researchers have claimed that the mean number of Comorbidities of the patients with heart disease is different than 3. You are going to test this hypothesis with the data. 1. (4 points). Create a histogram of Comorbidities and see if it looks approximately normal. Whether it does or not, explain why we can still continue to use the normal assumption and the t-distribution in the analysis of the sample mean. Include any appropriate theorems in your explanation or conditions. 2. (4 points) State the null and alternative hypothesis. 3. (4 points) Compute the sample mean and the sample standard deviation from the dataset. 4. (6 points) Compute the appropriate test statistic and P-value. Detail how you computed the P- value. 5. (4 points) Based on your results and a 5% significance level, do you accept the researcher's claim? How did you make that decision? 6. (4 points) Briefly explain what the phrase statistically significant means and how it applies to this situation. 7. (4 points) Discuss the effect on your conclusion above if you increased or decreased the significance level. ID NO 347 103 437 372 559 464 513 110 370 480 503 $1 273 374 400 466 637 322 264 535 436 Total.Claim Cost 4,511.59 1.686.34 933.85 865.88 27.032.75 1.144.75 73.55 6,819.5 603.72 3.239.8 315.93 5,978.4 1,060.89 988.18 566.66 13,270.65 2,848.93 40.111.17 299.21 96.67 156.01 5,468.57 55.72 1.988,62 2.410.69 1.211.62 4,700.75 1,691.92 35,091.71 1,368,19 586.17 919.92 849.16 263.83 1.625.05 32.87 1.304.39 3.019.7 218.42 220.65 33.43 Age Gender Interventions Drugs ER. Visits Complications Comorbidities Duration 55 1 0 2 0 1 26 58 2 0 1 0 8 348 61 2 0 3 0 4 294 59 2 2 0 3 0 4 61 2 16 0 5 0 13 207 2 0 0 3 0 5 230 53 2 2 3 6 0 0 1 65 1 1 1 4 0 0 0 51 2 2 0 3 0 8 184 59 2 6 0 3 1 6 354 66 1 2 0 3 0 0 161 61 1 4 0 1 0 9 303 52 1 4 1 3 0 7 317 57 1 2 0 3 0 3 159 67 1 2 0 1 0 10 316 52 2 10 0 4 0 1 143 49 2 1 0 0 0 7 85 66 2 10 0 5 0 23 351 2 4 0 0 0 0 185 65 2 2 0 11 0 0 36 62 1 1 0 4 0 1 122 58 2 7 0 4 0 18 248 41 1 1 1 6 0 0 0 46 1 6 0 0 0 1 2 43 2 1 0 2 0 15 252 SO 1 0 0 0 0 10 320 56 2 12 0 7 0 1 93 49 2 2 0 4 0 1 36 67 2 16 4 9 0 12 304 61 1 4 2 0 0 297 55 1 3 1 0 0 21 60 2 1 1 0 10 318 56 2 2 0 2 0 1 23 66 2 2 0 1 0 0 184 65 2 0 0 1 0 7 263 70 2 1 0 2 0 0 0 67 2 7 0 5 1 0 142 59 2 8 5 3 0 23 345 61 2 1 0 1 0 0 0 57 2 0 1 10 0 0 0 59 2 1 1 5 0 0 6 326 251 777 462 614 553 66 465 281 478 641 20 152 561 329 581 304 61 739 512 302 OOO --- Part II A health insurance company collected information on its subscribers who had made claims resulting from ischemic (coronary) heart disease. Data for 41 of the subscribers are included in the data set. The variables consist of the following: 1. ID: An identifying number for each individual. 2. Total Claim Cost: Total cost of claims by subscriber dollars) 3. Age: Age of subscriber (years) 4. Gender: Gender of subscriber: 1 if they identify as male, 2 if they identify as female, and 3 otherwise. 5. Interventions, Total number of interventions or procedures carried out 6. Drugs: Number of tracked drugs prescribed 7. ER Visits: Number of emergency room visits 8. Complications: Number of other complications that arose during heart disease treatment 9. Comorbidities: Number of other diseases that the subscriber had during period 10. Duration: Number of days of duration of treatment condition Researchers have claimed that the mean number of Comorbidities of the patients with heart disease is different than 3. You are going to test this hypothesis with the data. 1. (4 points). Create a histogram of Comorbidities and see if it looks approximately normal. Whether it does or not, explain why we can still continue to use the normal assumption and the t-distribution in the analysis of the sample mean. Include any appropriate theorems in your explanation or conditions. 2. (4 points) State the null and alternative hypothesis. 3. (4 points) Compute the sample mean and the sample standard deviation from the dataset. 4. (6 points) Compute the appropriate test statistic and P-value. Detail how you computed the P- value. 5. (4 points) Based on your results and a 5% significance level, do you accept the researcher's claim? How did you make that decision? 6. (4 points) Briefly explain what the phrase statistically significant means and how it applies to this situation. 7. (4 points) Discuss the effect on your conclusion above if you increased or decreased the significance level. ID NO 347 103 437 372 559 464 513 110 370 480 503 $1 273 374 400 466 637 322 264 535 436 Total.Claim Cost 4,511.59 1.686.34 933.85 865.88 27.032.75 1.144.75 73.55 6,819.5 603.72 3.239.8 315.93 5,978.4 1,060.89 988.18 566.66 13,270.65 2,848.93 40.111.17 299.21 96.67 156.01 5,468.57 55.72 1.988,62 2.410.69 1.211.62 4,700.75 1,691.92 35,091.71 1,368,19 586.17 919.92 849.16 263.83 1.625.05 32.87 1.304.39 3.019.7 218.42 220.65 33.43 Age Gender Interventions Drugs ER. Visits Complications Comorbidities Duration 55 1 0 2 0 1 26 58 2 0 1 0 8 348 61 2 0 3 0 4 294 59 2 2 0 3 0 4 61 2 16 0 5 0 13 207 2 0 0 3 0 5 230 53 2 2 3 6 0 0 1 65 1 1 1 4 0 0 0 51 2 2 0 3 0 8 184 59 2 6 0 3 1 6 354 66 1 2 0 3 0 0 161 61 1 4 0 1 0 9 303 52 1 4 1 3 0 7 317 57 1 2 0 3 0 3 159 67 1 2 0 1 0 10 316 52 2 10 0 4 0 1 143 49 2 1 0 0 0 7 85 66 2 10 0 5 0 23 351 2 4 0 0 0 0 185 65 2 2 0 11 0 0 36 62 1 1 0 4 0 1 122 58 2 7 0 4 0 18 248 41 1 1 1 6 0 0 0 46 1 6 0 0 0 1 2 43 2 1 0 2 0 15 252 SO 1 0 0 0 0 10 320 56 2 12 0 7 0 1 93 49 2 2 0 4 0 1 36 67 2 16 4 9 0 12 304 61 1 4 2 0 0 297 55 1 3 1 0 0 21 60 2 1 1 0 10 318 56 2 2 0 2 0 1 23 66 2 2 0 1 0 0 184 65 2 0 0 1 0 7 263 70 2 1 0 2 0 0 0 67 2 7 0 5 1 0 142 59 2 8 5 3 0 23 345 61 2 1 0 1 0 0 0 57 2 0 1 10 0 0 0 59 2 1 1 5 0 0 6 326 251 777 462 614 553 66 465 281 478 641 20 152 561 329 581 304 61 739 512 302 OOO