Answered step by step
Verified Expert Solution
Link Copied!

Question

1 Approved Answer

This week,you are an analyst a a large consulting firm in the internal analytics group.Your team is looking at consultants' expenses, and trying to find

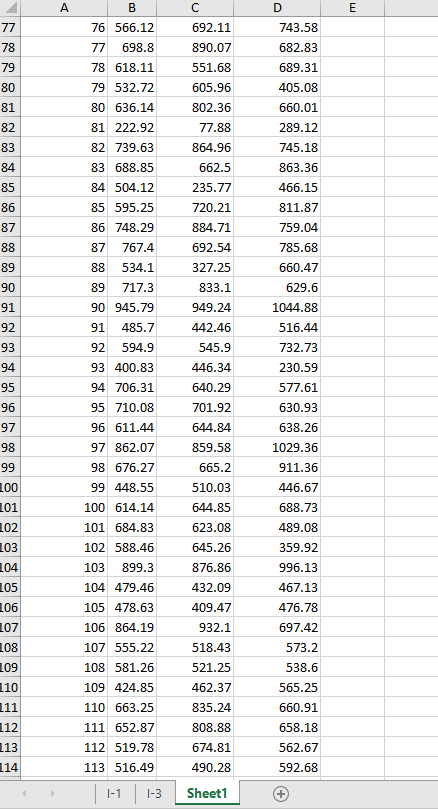
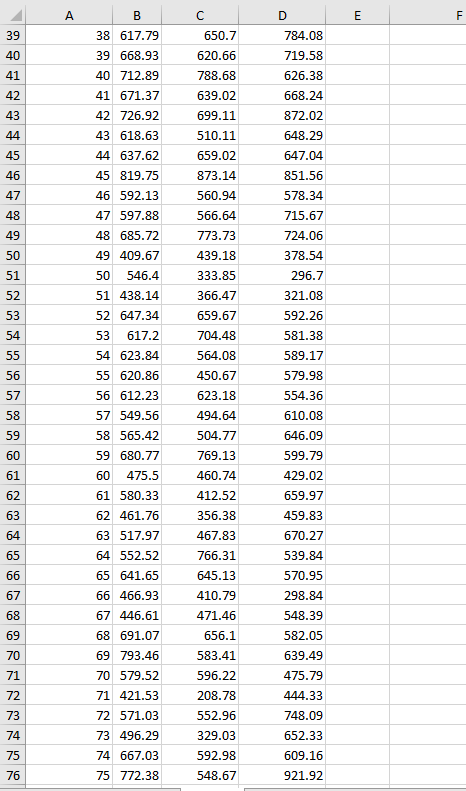
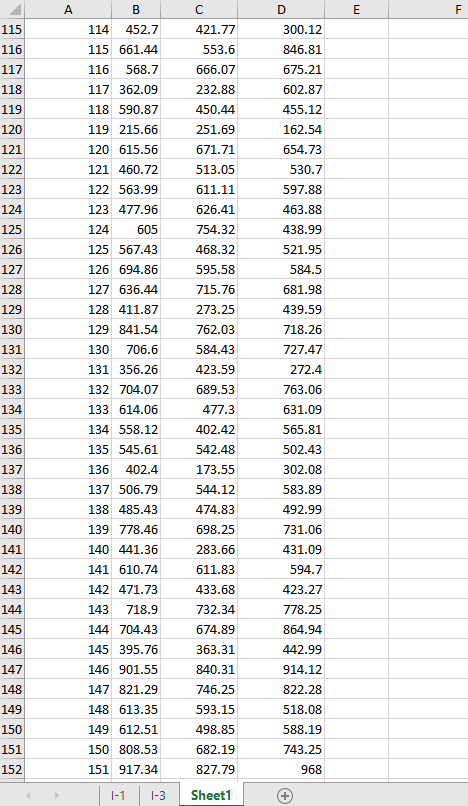
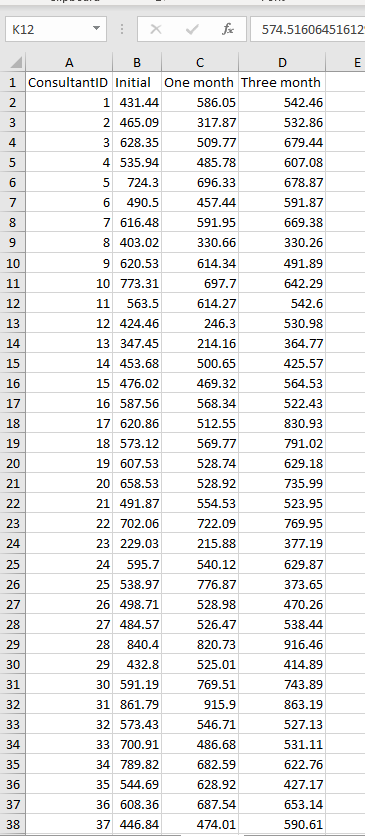
This week,you are an analyst a a large consulting firm in the internal analytics group.Your team is looking at consultants' expenses, and trying to find a way to get those down using behavioral "nudges". First, you will identify which consultants have expenses in the top 10%. Second, you will analyze the results of a pilot experiment your team has done to try to get expenses down. In that experiment, you sent out emails to top expense-generating consultants letting them know that they had among the highest expenses of any consultants in the company. You recorded their initial daily expenses, their expenses a month after the email, and their expenses 3 months after the email. You would like to know whether the email resulted in the consultants decreasing their expenses, either immediately or over time.

Task 1:Determine which consultants in New York City and Chicago are among the top 10% of expense-generators

  • Use the "Expenses NYC and Chicago" data
  • What z-score would 10% of consultants have expenses above? You can find this in Excel or any other way you know how. (Hint: you're looking for the theoretical value here, not anything based on the actual data.)
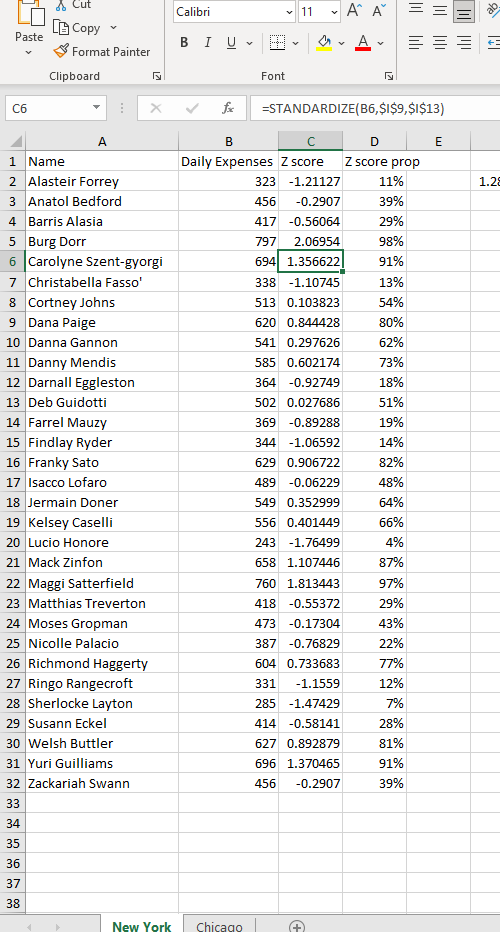
  • Calculate z-scores for the NYC consultants (using the NYC sample mean and standard deviation). Do this in Excel.
  • Calculate z-scores for the Chicago consultants (using the Chicago sample mean and standard deviation). Do this in Excel
  • Identify the NYC and Chicago consultants who have z-scores higher than the threshold you identified earlier.

Task 2: Analyze data from a pilot experiment to determine whether an intervention lowered consultant expenses

  • Use the "Expenses experiment" data
  • Calculate the mean expenses for each of the three sets of data: Initial, One month, and Three month
  • Perform a paired t-test to determine if expenses fell from Initial to One month
  • Perform a paired t-test to determine if expenses fell from Initial to Three month
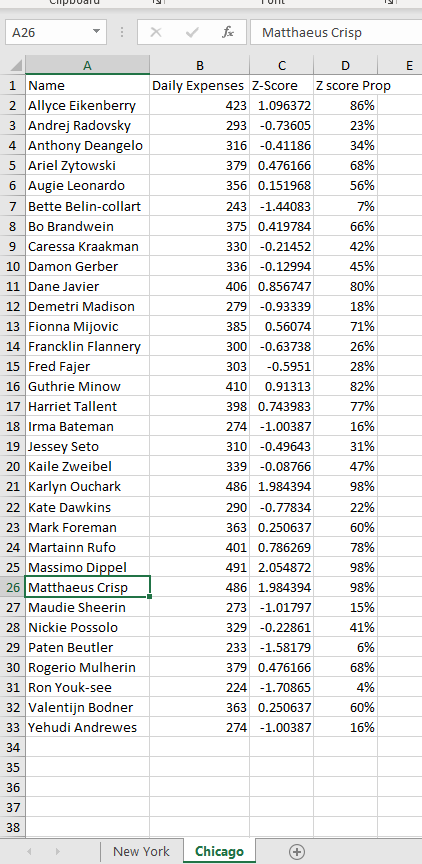
image text in transcribedimage text in transcribedimage text in transcribedimage text in transcribedimage text in transcribedimage text in transcribedimage text in transcribed
\fA B C D E 77 76 566.12 692.11 743.58 78 77 698.8 890.07 682.83 79 78 618.11 551.68 689.31 80 79 532.72 605.96 405.08 81 80 636.14 802.36 660.01 82 81 222.92 77.88 289.12 83 82 739.63 864.96 745.18 84 83 688.85 662.5 863.36 85 84 504.12 235.77 466.15 86 85 595.25 720.21 811.87 87 86 748.29 884.71 759.04 88 87 767.4 692.54 785.68 89 38 534.1 327.25 660.47 90 89 717.3 833.1 629.6 91 90 945.79 949.24 1044.88 92 91 485.7 442.46 516.44 93 92 594.9 545.9 732.73 94 93 400.83 446.34 230.59 95 94 706.31 640.29 577.61 96 95 710.08 701.92 630.93 97 96 611.44 644.84 638.26 98 97 862.07 859.58 1029.36 99 98 676.27 665.2 911.36 00 99 448.55 510.03 446.67 01 100 614.14 644.85 688.73 02 101 684.83 623.08 489.08 03 102 588.46 645.26 359.92 04 103 899.3 876.86 996.13 05 104 479.46 432.09 467.13 .06 105 478.63 409.47 476.78 07 106 864.19 932.1 697.42 08 107 555.22 518.43 573.2 09 108 581.26 521.25 538.6 10 109 424.85 462.37 565.25 11 110 663.25 835.24 660.91 .12 111 652.87 808.88 658.18 13 112 519.78 674.81 562.67 14 113 516.49 490.28 592.68 1-1 1-3 Sheet1 (+\f\f\f\fLut Calibri 11 = LG Copy Paste BIU A = Format Painter Clipboard Font C6 X V =STANDARDIZE(B6,$1$9,$1$13) A B C D E 1 Name Daily Expenses Z score Z score prop Alasteir Forrey 323 -1.21127 11% 1.2 3 Anatol Bedford 456 -0.2907 39% 4 Barris Alasia 417 -0.56064 29% 5 Burg Dorr 797 2.06954 98% 6 Carolyne Szent-gyorgi 694 1.356622 91% 7 Christabella Fasso' 338 -1.10745 13% 8 Cortney Johns 513 0.103823 54% 9 Dana Paige 620 0.844428 80% 10 Danna Gannon 541 0.297626 62% 11 Danny Mendis 585 0.602174 73% 12 Darnall Eggleston 364 -0.92749 18% 13 Deb Guidotti 502 0.027686 51% 14 Farrel Mauzy 369 -0.89288 19% 15 Findlay Ryder 344 -1.06592 14% 16 Franky Sato 629 0.906722 82% 17 Isacco Lofaro 489 -0.06229 48% 18 Jermain Doner 549 0.352999 64% 19 Kelsey Caselli 556 0.401449 66% 20 Lucio Honore 243 -1.76499 4% 21 Mack Zinfon 658 1.107446 87% 22 Maggi Satterfield 760 1.813443 97% 23 Matthias Treverton 418 -0.55372 29% 24 Moses Gropman 473 -0.17304 43% 25 Nicolle Palacio 387 -0.76829 22% 26 Richmond Haggerty 604 0.733683 77% 27 Ringo Rangecroft 331 -1.1559 12% 28 Sherlocke Layton 285 -1.47429 7% 29 Susann Eckel 414 -0.58141 28% 30 Welsh Buttler 627 0.892879 81% 31 Yuri Guilliams 696 1.370465 91% 32 Zackariah Swann 456 -0.2907 39% 33 34 35 36 37 38 New York Chicago

Step by Step Solution

There are 3 Steps involved in it

Step: 1

blur-text-image

Get Instant Access to Expert-Tailored Solutions

See step-by-step solutions with expert insights and AI powered tools for academic success

Step: 2

blur-text-image_2

Step: 3

blur-text-image_3

Ace Your Homework with AI

Get the answers you need in no time with our AI-driven, step-by-step assistance

Get Started

Recommended Textbook for

Information Technology Project Management

Authors: Kathy Schwalbe

6th Edition

978-111122175, 1133172393, 9780324786927, 1111221758, 9781133172390, 324786921, 978-1133153726

More Books

Students also viewed these General Management questions