

Answered step by step
Verified Expert Solution
Question
1 Approved Answer
: Three months have passed since you created your first financial plan (i.e., the Unit 2 Touchstone). In that time, your budget has gone
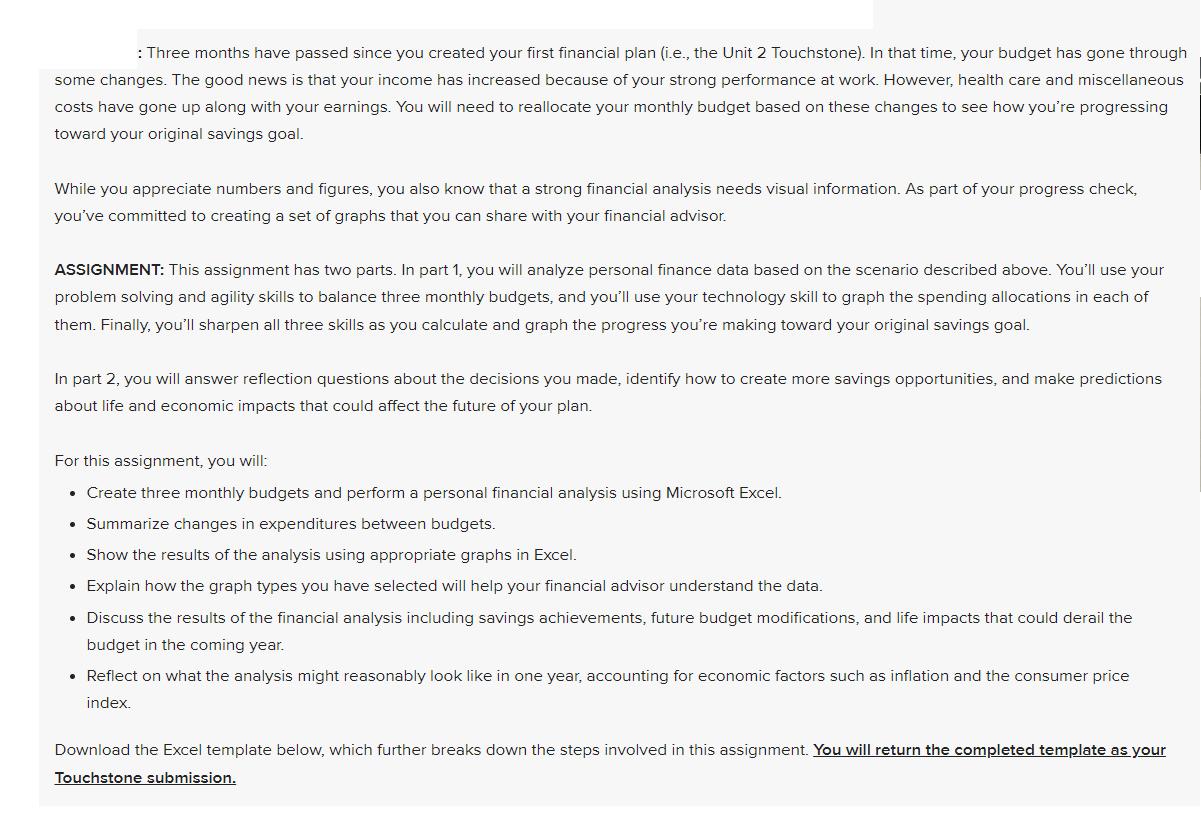
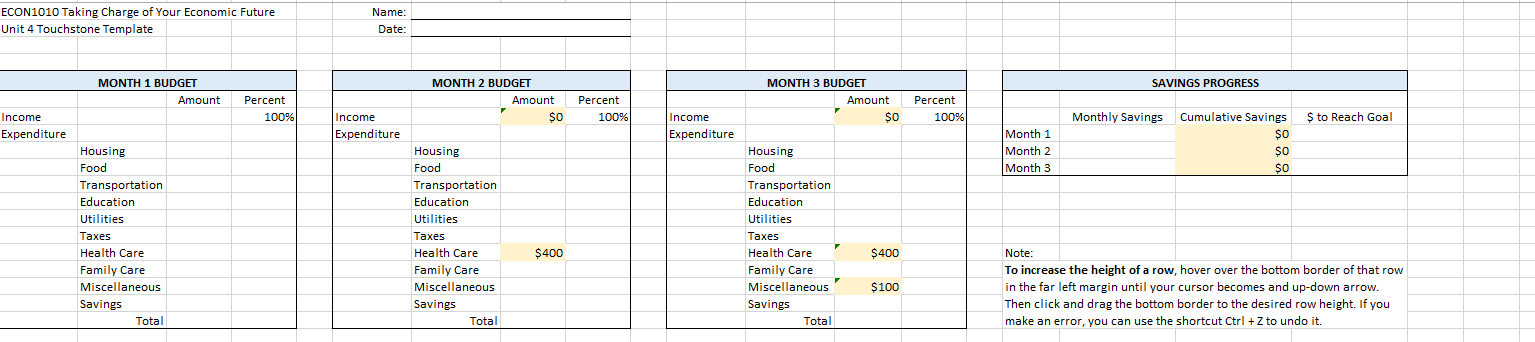
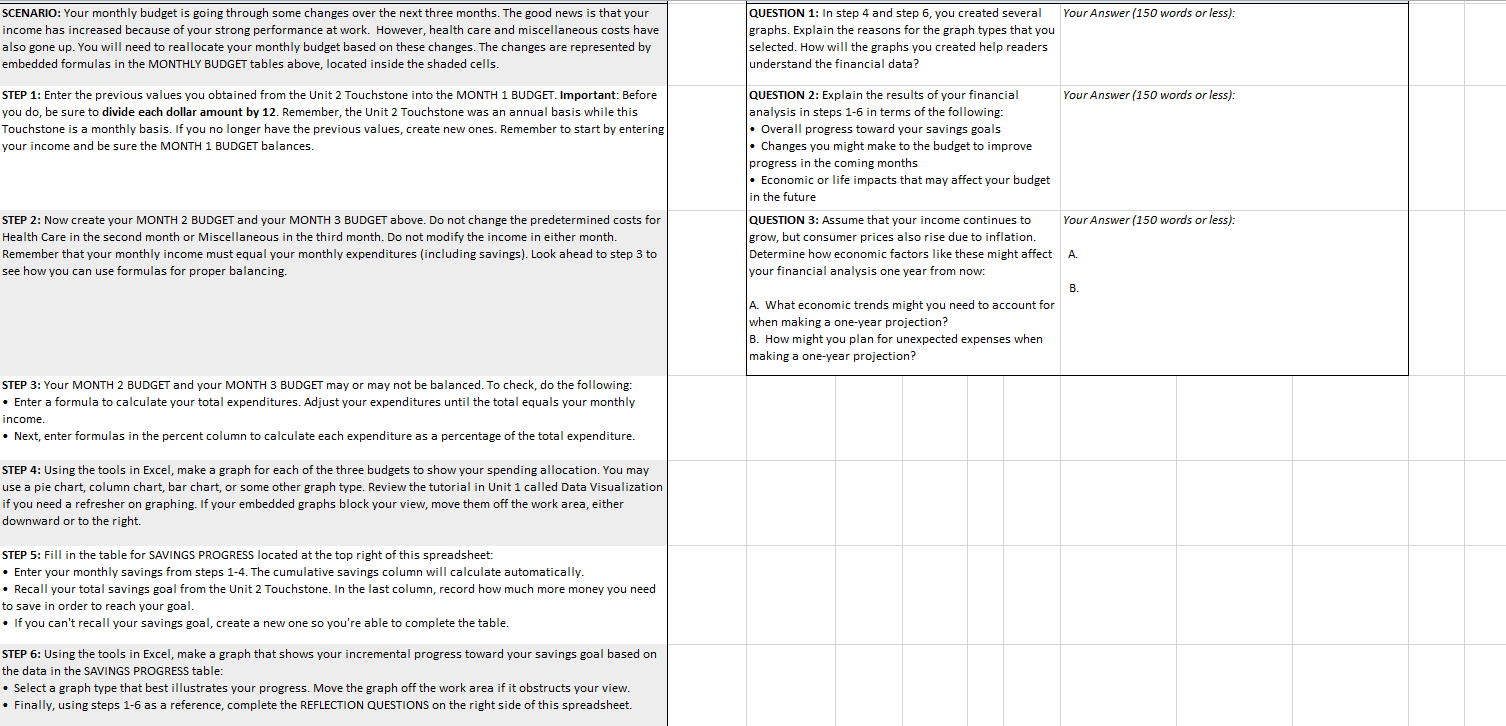
: Three months have passed since you created your first financial plan (i.e., the Unit 2 Touchstone). In that time, your budget has gone through some changes. The good news is that your income has increased because of your strong performance at work. However, health care and miscellaneous costs have gone up along with your earnings. You will need to reallocate your monthly budget based on these changes to see how you're progressing toward your original savings goal. While you appreciate numbers and figures, you also know that a strong financial analysis needs visual information. As part of your progress check, you've committed to creating a set of graphs that you can share with your financial advisor. ASSIGNMENT: This assignment has two parts. In part 1, you will analyze personal finance data based on the scenario described above. You'll use your problem solving and agility skills to balance three monthly budgets, and you'll use your technology skill to graph the spending allocations in each of them. Finally, you'll sharpen all three skills as you calculate and graph the progress you're making toward your original savings goal. In part 2, you will answer reflection questions about the decisions you made, identify how to create more savings opportunities, and make predictions about life and economic impacts that could affect the future of your plan. For this assignment, you will: Create three monthly budgets and perform a personal financial analysis using Microsoft Excel. Summarize changes in expenditures between budgets. Show the results of the analysis using appropriate graphs in Excel. Explain how the graph types you have selected will help your financial advisor understand the data. Discuss the results of the financial analysis including savings achievements, future budget modifications, and life impacts that could derail the budget in the coming year. Reflect on what the analysis might reasonably look like in one year, accounting for economic factors such as inflation and the consumer price index. Download the Excel template below, which further breaks down the steps involved in this assignment. You will return the completed template as your Touchstone submission. ECON1010 Taking Charge of Your Economic Future Unit 4 Touchstone Template Income MONTH 1 BUDGET Amount Percent 100% Income Expenditure Housing Food Name: Date: Expenditure MONTH 2 BUDGET Housing MONTH 3 BUDGET Amount Percent $0 100% Income Expenditure Housing Food SAVINGS PROGRESS Amount $0 Percent 100% Monthly Savings Month 1 Month 2 Month 3 Transportation Education Utilities Taxes Food Transportation Education Utilities Transportation Education Utilities Taxes Taxes Health Care Health Care $400 Health Care $400 Family Care Miscellaneous Savings Family Care Family Care Miscellaneous Miscellaneous $100 Savings Savings Total Total Total Cumulative Savings $ to Reach Goal $0 $0 $0 Note: To increase the height of a row, hover over the bottom border of that row in the far left margin until your cursor becomes and up-down arrow. Then click and drag the bottom border to the desired row height. If you make an error, you can use the shortcut Ctrl + Z to undo it. Your Answer (150 words or less): Your Answer (150 words or less): SCENARIO: Your monthly budget is going through some changes over the next three months. The good news is that your income has increased because of your strong performance at work. However, health care and miscellaneous costs have also gone up. You will need to reallocate your monthly budget based on these changes. The changes are represented by embedded formulas in the MONTHLY BUDGET tables above, located inside the shaded cells. STEP 1: Enter the previous values you obtained from the Unit 2 Touchstone into the MONTH 1 BUDGET. Important: Before you do, be sure to divide each dollar amount by 12. Remember, the Unit 2 Touchstone was an annual basis while this Touchstone is a monthly basis. If you no longer have the previous values, create new ones. Remember to start by entering your income and be sure the MONTH 1 BUDGET balances. STEP 2: Now create your MONTH 2 BUDGET and your MONTH 3 BUDGET above. Do not change the predetermined costs for Health Care in the second month or Miscellaneous in the third month. Do not modify the income in either month. Remember that your monthly income must equal your monthly expenditures (including savings). Look ahead to step 3 to see how you can use formulas for proper balancing. QUESTION 1: In step 4 and step 6, you created several graphs. Explain the reasons for the graph types that you selected. How will the graphs you created help readers understand the financial data? QUESTION 2: Explain the results of your financial analysis in steps 1-6 in terms of the following: Overall progress toward your savings goals Changes you might make to the budget to improve progress in the coming months Economic or life impacts that may affect your budget in the future QUESTION 3: Assume that your income continues to grow, but consumer prices also rise due to inflation. Determine how economic factors like these might affect A. your financial analysis one year from now: A. What economic trends might you need to account for when making a one-year projection? B. How might you plan for unexpected expenses when making a one-year projection? B. STEP 3: Your MONTH 2 BUDGET and your MONTH 3 BUDGET may or may not be balanced. To check, do the following: Enter a formula to calculate your total expenditures. Adjust your expenditures until the total equals your monthly income. Next, enter formulas in the percent column to calculate each expenditure as a percentage of the total expenditure. STEP 4: Using the tools in Excel, make a graph for each of the three budgets to show your spending allocation. You may use a pie chart, column chart, bar chart, or some other graph type. Review the tutorial in Unit 1 called Data Visualization if you need a refresher on graphing. If your embedded graphs block your view, move them off the work area, either downward or to the right. STEP 5: Fill in the table for SAVINGS PROGRESS located at the top right of this spreadsheet: Enter your monthly savings from steps 1-4. The cumulative savings column will calculate automatically. Recall your total savings goal from the Unit 2 Touchstone. In the last column, record how much more money you need to save in order to reach your goal. If you can't recall your savings goal, create a new one so you're able to complete the table. STEP 6: Using the tools in Excel, make a graph that shows your incremental progress toward your savings goal based on the data in the SAVINGS PROGRESS table: Select a graph type that best illustrates your progress. Move the graph off the work area if it obstructs your view. Finally, using steps 1-6 as a reference, complete the REFLECTION QUESTIONS on the right side of this spreadsheet. Your Answer (150 words or less):
Step by Step Solution
There are 3 Steps involved in it
Step: 1

Get Instant Access to Expert-Tailored Solutions
See step-by-step solutions with expert insights and AI powered tools for academic success
Step: 2

Step: 3
Ace Your Homework with AI
Get the answers you need in no time with our AI-driven, step-by-step assistance
Get Started
Econometric Analysis
Authors: William H. Greene
5th Edition
130661899, 978-0130661890