Answered step by step
Verified Expert Solution
Question
1 Approved Answer
through the observation and collection of the data from the price of real estate market and its neighboring environment quality, we may plot a regression

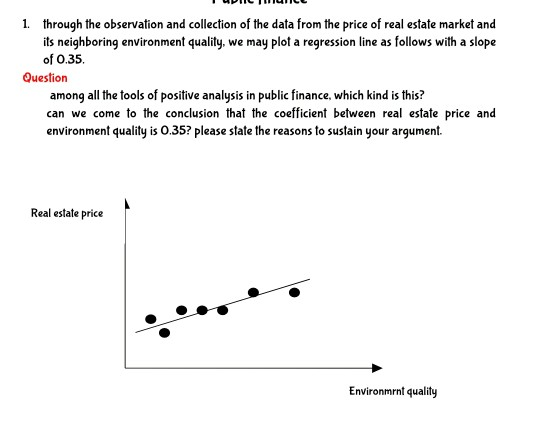
through the observation and collection of the data from the price of real estate market and its neighboring environment quality, we may plot a regression line as follows with a slope of 0.35. Question among all the tools of positive analysis in public finance, which kind is this? can we come to the conclusion that the coefficient between real estate price and environment quality is 0.35? please state the reasons to sustain your argument
1. through the observation and collection of the data from the price of real estate market and its neighboring environment quality, we may plot a regression line as follows with a slope of 0.35 Question among all the tools of positive analysis in public finance, which kind is this? can we come to the conclusion that the coefficient between real estate price and environment quality is 0.35? please state the reasons to sustain your argument. Real estate price Environment qualityStep by Step Solution
There are 3 Steps involved in it
Step: 1

Get Instant Access to Expert-Tailored Solutions
See step-by-step solutions with expert insights and AI powered tools for academic success
Step: 2

Step: 3

Ace Your Homework with AI
Get the answers you need in no time with our AI-driven, step-by-step assistance
Get Started


