Answered step by step
Verified Expert Solution
Link Copied!

Question

1 Approved Answer

Time Series and Analysis with R studio 1. Use R to load in the data from cbe.dat. Answer the following questions using that data set.

Time Series and Analysis with R studioimage text in transcribed

1. Use R to load in the data from cbe.dat. Answer the following questions using that data set. Plot the electricity data. From the plot, does the data appear to be stationary in the mean? Does it appear to be stationary in the variance? Explain your answer. Decompose the data series and calculate the mean, variance, and standard deviation for the seasonal and random components of the decomposition. Plot the correlogram of the electricity data. What does the shape of the correlogram indicate about the electricity data? Give the lag 1 autocorrelation. Plot the autocorrelation of the random part of the decomposition (hint: you will need to either remove the NA values from the time series or tell acf to ignore them). What does the correlogram tell us about the random data - is it a series of independent random variables? Explain your answer and what it tells us about the model we used for the electricity data. 2. bookwebfiles\global.dat contains monthly global mean temperature data from 1856 to 2005, represented as deviation from the mean global temperature during 1961-1990. Read in the time series and decompose it either additively or multiplicatively. Explain why you chose the decomposition that you did. Produce a plot of the error term only. Does the error appear to be stationary in the mean? Stationary in the variance? Explain why you gave the answers you did. Plot the correlogram of the error term. What are the statistically significant correlations? Does this appear to be random data? 3. For each of the following time series, state whether it is stationary in the mean, decompose it additively or multiplicatively, and plot the correlogram of the error term. Identify the statistically significant autocorrelations and explain why they make sense. a.ts x

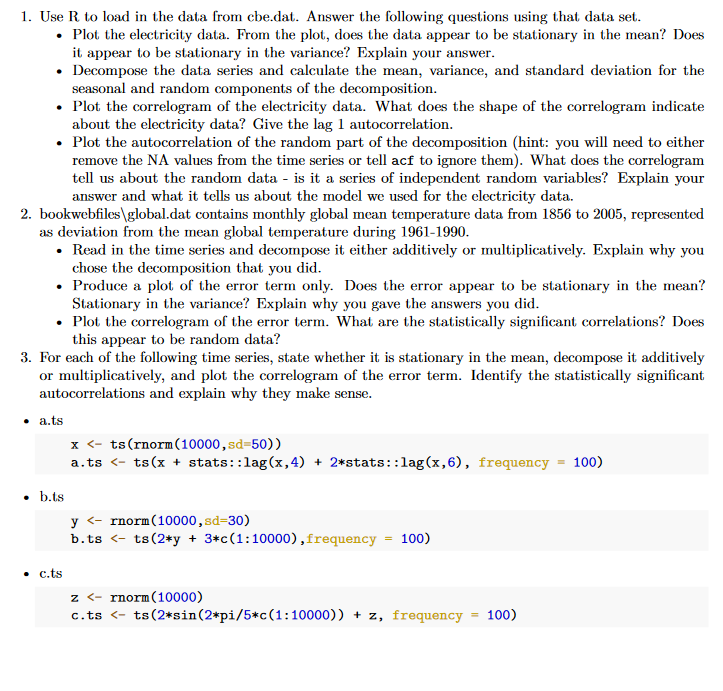
Step by Step Solution

There are 3 Steps involved in it

Step: 1

blur-text-image

Get Instant Access to Expert-Tailored Solutions

See step-by-step solutions with expert insights and AI powered tools for academic success

Step: 2

blur-text-image

Step: 3

blur-text-image

Ace Your Homework with AI

Get the answers you need in no time with our AI-driven, step-by-step assistance

Get Started

Recommended Textbook for

Graph Databases In Action

Authors: Dave Bechberger, Josh Perryman

1st Edition

1617296376, 978-1617296376

More Books

Students also viewed these Databases questions

Question

Understand developments in knowledge creation and management

Answered: 1 week ago

Question

What tools might be helpful?

Answered: 1 week ago