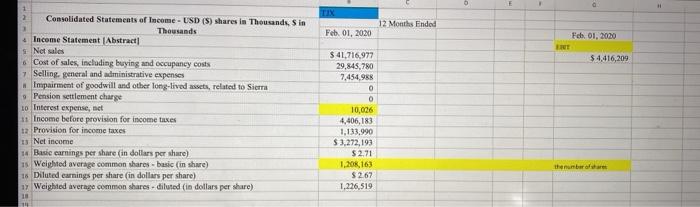
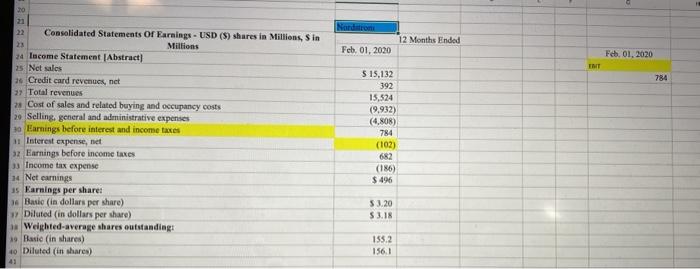
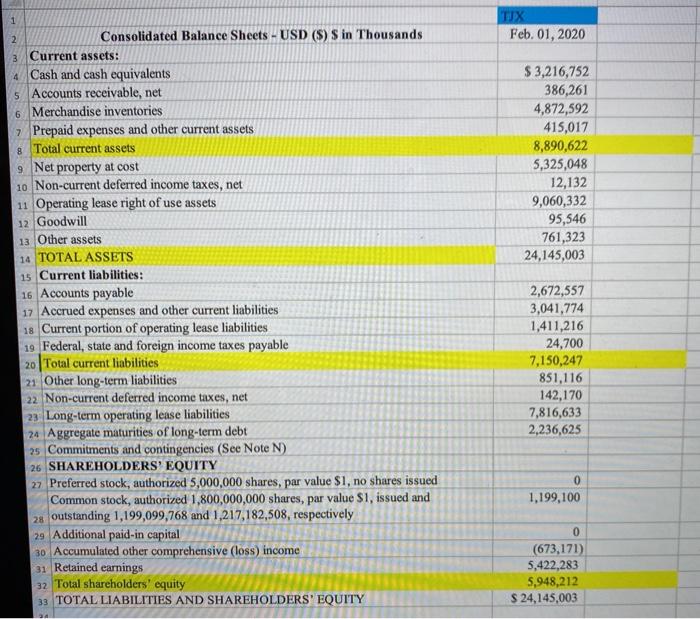
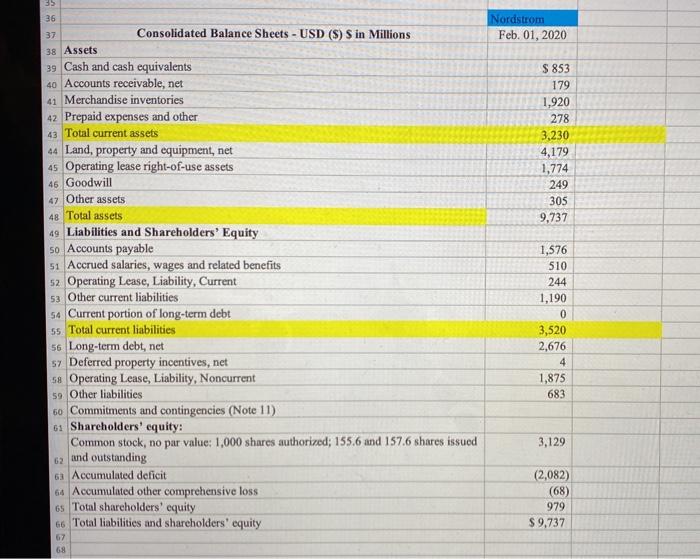
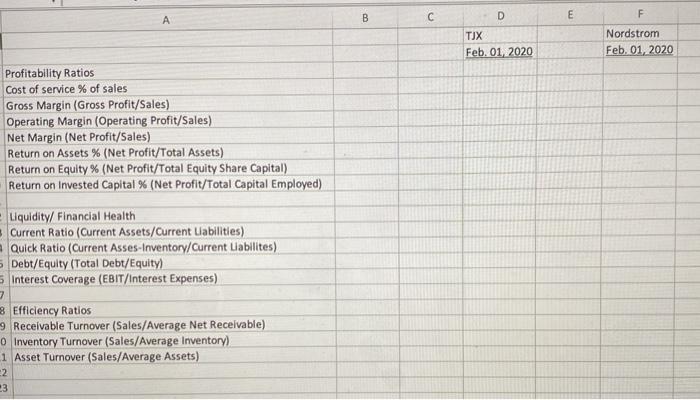
TJMaxx (TJX), Inc and Nordstrom, Inc are the two companies in the same industry. Please use the financial ratio analysis that you have learned from the course to compare these two companies. 6 E a TIX 12 Months Ended Feb 01, 2020 Feb 01, 2020 LRT $ 4,416,209 Consolidated Statements of Income - USD (S) shares in Thousands Sin Thousands Income Statement Abstract Not sales 6 Cost of sales, including buying and occupancy costs 1 Selling general and administrative expenses Impairment of goodwill and other long-lived assets, related to Sierra Pension settlement charge to Interest expense, net 1. Income before provision for income taxes 12 Provision for income taxes 13 Net income 1 Basic carnings per share in dollars per share) Is Weighted average common shares - basic (in share) 16 Diluted earnings per share in dollars per share) 17 Weighted average common shares - diluted (in dollars per share) 10 $ 41,716,977 29,845,780 7.454,988 0 0 10,026 4,406,183 1.133.990 $3,272,193 $2.71 1,206,163 $ 267 1,226,519 thenumber 12 Months Ended Feb. 01, 2020 Feb. 01. 2020 EMT 784 20 21 Consolidated Statements of Earnings- USD ($) shares in Millions, Sin Millions 24 Income Statement Abstract 25 Not sales 2 Credit card revenues, net 3 Total revenues Cost of sales and related buying and occupancy costs 29 Selling, general and administrative expenses 10 Earnings before interest and income taxes * Interest expense, net 32 Earnings before income taxes 33 Income tax expense Net earnings us Earnings per shares 3 Basic (in dollars per share) Diluted (in dollars per share) Weighted average shares outstandings 19 Basic (in shares) 40 Diluted in shares) 5 15,132 392 15,524 (9,932) (4.808) 784 (102) (186) $ 496 5 3.20 53.18 155.2 156.1 1 TUX Feb. 01, 2020 2 $ 3,216,752 386,261 4,872,592 415,017 8,890,622 5,325,048 12,132 9,060,332 95,546 761,323 24,145,003 Consolidated Balance Sheets - USD ($) $ in Thousands 3 Current assets: 4 Cash and cash equivalents 5 Accounts receivable, net 6 Merchandise inventories 7 Prepaid expenses and other current assets 8 Total current assets 9 Net property at cost 10 Non-current deferred income taxes, net 11 Operating lease right of use assets 12 Goodwill 13 Other assets 14 TOTAL ASSETS 15 Current liabilities: 16 Accounts payable 17 Accrued expenses and other current liabilities 18 Current portion of operating lease liabilities 19 Federal, state and foreign income taxes payable 20 Total current liabilities 21 Other long-term liabilities 22 Non-current deferred income taxes, net 23 Long-term operating lease liabilities 24 Aggregate maturities of long-term debt 25 Commitments and contingencies (See Note N) 26 SHAREHOLDERS' EQUITY 27 Preferred stock, authorized 5,000,000 shares, par value $1, no shares issued Common stock, authorized 1,800,000,000 shares, par value $1, issued and 28 outstanding 1,199,099,768 and 1,217,182,508, respectively 29 Additional paid-in capital 30 Accumulated other comprehensive (loss) income 31 Retained earnings 32 Total shareholders' equity 33 TOTAL LIABILITIES AND SHAREHOLDERS' EQUITY 2,672,557 3,041,774 1,411,216 24,700 7,150,247 851,116 142,170 7,816,633 2,236,625 0 1,199,100 0 (673,171) 5,422,283 5,948,212 $ 24,145,003 35 36 Nordstrom Feb. 01, 2020 37 Consolidated Balance Sheets - USD (S) S in Millions 38 Assets $ 853 179 1,920 278 3,230 4,179 1,774 249 305 9,737 39 Cash and cash equivalents 40 Accounts receivable, net 41 Merchandise inventories 42 Prepaid expenses and other 43 Total current assets 44 Land, property and equipment, net 45 Operating lease right-of-use assets 46 Goodwill 47 Other assets 48 Total assets 49 Liabilities and Shareholders' Equity 50 Accounts payable 51 Accrued salaries, wages and related benefits 52 Operating Lease, Liability, Current 53 Other current liabilities 54 Current portion of long-term debt 55 Total current liabilities 56 Long-term debt, net sy Deferred property incentives, net sa Operating Lease, Liability, Noncurrent 59 Other liabilities 60 Commitments and contingencies (Note 11) 61 Shareholders' equity: Common stock, no par value: 1,000 shares authorized; 155.6 and 157.6 shares issued 62 and outstanding 63 Accumulated deficit 64 Accumulated other comprehensive loss 65 Total shareholders' equity 66 Total liabilities and shareholders' equity 1,576 510 244 1,190 0 3,520 2,676 4 1,875 683 3,129 (2,082) (68) 979 $ 9,737 67 68 B A D E F TJX Feb. 01, 2020 Nordstrom Feb. 01, 2020 Profitability Ratios Cost of service % of sales Gross Margin (Gross Profit/Sales) Operating Margin (Operating Profit/Sales) Net Margin (Net Profit/Sales) Return on Assets % (Net Profit/Total Assets) Return on Equity % (Net Profit/Total Equity Share Capital) Return on invested Capital % (Net Profit/Total Capital Employed) Liquidity/ Financial Health Current Ratio (Current Assets/Current Labilities) Quick Ratio (Current Asses-Inventory/Current Liabilites) 5 Debt/Equity (Total Debt/Equity) Interest Coverage (EBIT/Interest Expenses) 7 3 Efficiency Ratios 9 Receivable Turnover (Sales/Average Net Receivable) 0 Inventory Turnover (Sales/Average Inventory) 1 Asset Turnover (Sales/Average Assets) 2 3 TJMaxx (TJX), Inc and Nordstrom, Inc are the two companies in the same industry. Please use the financial ratio analysis that you have learned from the course to compare these two companies. 6 E a TIX 12 Months Ended Feb 01, 2020 Feb 01, 2020 LRT $ 4,416,209 Consolidated Statements of Income - USD (S) shares in Thousands Sin Thousands Income Statement Abstract Not sales 6 Cost of sales, including buying and occupancy costs 1 Selling general and administrative expenses Impairment of goodwill and other long-lived assets, related to Sierra Pension settlement charge to Interest expense, net 1. Income before provision for income taxes 12 Provision for income taxes 13 Net income 1 Basic carnings per share in dollars per share) Is Weighted average common shares - basic (in share) 16 Diluted earnings per share in dollars per share) 17 Weighted average common shares - diluted (in dollars per share) 10 $ 41,716,977 29,845,780 7.454,988 0 0 10,026 4,406,183 1.133.990 $3,272,193 $2.71 1,206,163 $ 267 1,226,519 thenumber 12 Months Ended Feb. 01, 2020 Feb. 01. 2020 EMT 784 20 21 Consolidated Statements of Earnings- USD ($) shares in Millions, Sin Millions 24 Income Statement Abstract 25 Not sales 2 Credit card revenues, net 3 Total revenues Cost of sales and related buying and occupancy costs 29 Selling, general and administrative expenses 10 Earnings before interest and income taxes * Interest expense, net 32 Earnings before income taxes 33 Income tax expense Net earnings us Earnings per shares 3 Basic (in dollars per share) Diluted (in dollars per share) Weighted average shares outstandings 19 Basic (in shares) 40 Diluted in shares) 5 15,132 392 15,524 (9,932) (4.808) 784 (102) (186) $ 496 5 3.20 53.18 155.2 156.1 1 TUX Feb. 01, 2020 2 $ 3,216,752 386,261 4,872,592 415,017 8,890,622 5,325,048 12,132 9,060,332 95,546 761,323 24,145,003 Consolidated Balance Sheets - USD ($) $ in Thousands 3 Current assets: 4 Cash and cash equivalents 5 Accounts receivable, net 6 Merchandise inventories 7 Prepaid expenses and other current assets 8 Total current assets 9 Net property at cost 10 Non-current deferred income taxes, net 11 Operating lease right of use assets 12 Goodwill 13 Other assets 14 TOTAL ASSETS 15 Current liabilities: 16 Accounts payable 17 Accrued expenses and other current liabilities 18 Current portion of operating lease liabilities 19 Federal, state and foreign income taxes payable 20 Total current liabilities 21 Other long-term liabilities 22 Non-current deferred income taxes, net 23 Long-term operating lease liabilities 24 Aggregate maturities of long-term debt 25 Commitments and contingencies (See Note N) 26 SHAREHOLDERS' EQUITY 27 Preferred stock, authorized 5,000,000 shares, par value $1, no shares issued Common stock, authorized 1,800,000,000 shares, par value $1, issued and 28 outstanding 1,199,099,768 and 1,217,182,508, respectively 29 Additional paid-in capital 30 Accumulated other comprehensive (loss) income 31 Retained earnings 32 Total shareholders' equity 33 TOTAL LIABILITIES AND SHAREHOLDERS' EQUITY 2,672,557 3,041,774 1,411,216 24,700 7,150,247 851,116 142,170 7,816,633 2,236,625 0 1,199,100 0 (673,171) 5,422,283 5,948,212 $ 24,145,003 35 36 Nordstrom Feb. 01, 2020 37 Consolidated Balance Sheets - USD (S) S in Millions 38 Assets $ 853 179 1,920 278 3,230 4,179 1,774 249 305 9,737 39 Cash and cash equivalents 40 Accounts receivable, net 41 Merchandise inventories 42 Prepaid expenses and other 43 Total current assets 44 Land, property and equipment, net 45 Operating lease right-of-use assets 46 Goodwill 47 Other assets 48 Total assets 49 Liabilities and Shareholders' Equity 50 Accounts payable 51 Accrued salaries, wages and related benefits 52 Operating Lease, Liability, Current 53 Other current liabilities 54 Current portion of long-term debt 55 Total current liabilities 56 Long-term debt, net sy Deferred property incentives, net sa Operating Lease, Liability, Noncurrent 59 Other liabilities 60 Commitments and contingencies (Note 11) 61 Shareholders' equity: Common stock, no par value: 1,000 shares authorized; 155.6 and 157.6 shares issued 62 and outstanding 63 Accumulated deficit 64 Accumulated other comprehensive loss 65 Total shareholders' equity 66 Total liabilities and shareholders' equity 1,576 510 244 1,190 0 3,520 2,676 4 1,875 683 3,129 (2,082) (68) 979 $ 9,737 67 68 B A D E F TJX Feb. 01, 2020 Nordstrom Feb. 01, 2020 Profitability Ratios Cost of service % of sales Gross Margin (Gross Profit/Sales) Operating Margin (Operating Profit/Sales) Net Margin (Net Profit/Sales) Return on Assets % (Net Profit/Total Assets) Return on Equity % (Net Profit/Total Equity Share Capital) Return on invested Capital % (Net Profit/Total Capital Employed) Liquidity/ Financial Health Current Ratio (Current Assets/Current Labilities) Quick Ratio (Current Asses-Inventory/Current Liabilites) 5 Debt/Equity (Total Debt/Equity) Interest Coverage (EBIT/Interest Expenses) 7 3 Efficiency Ratios 9 Receivable Turnover (Sales/Average Net Receivable) 0 Inventory Turnover (Sales/Average Inventory) 1 Asset Turnover (Sales/Average Assets) 2 3