Answered step by step
Verified Expert Solution
Question
1 Approved Answer
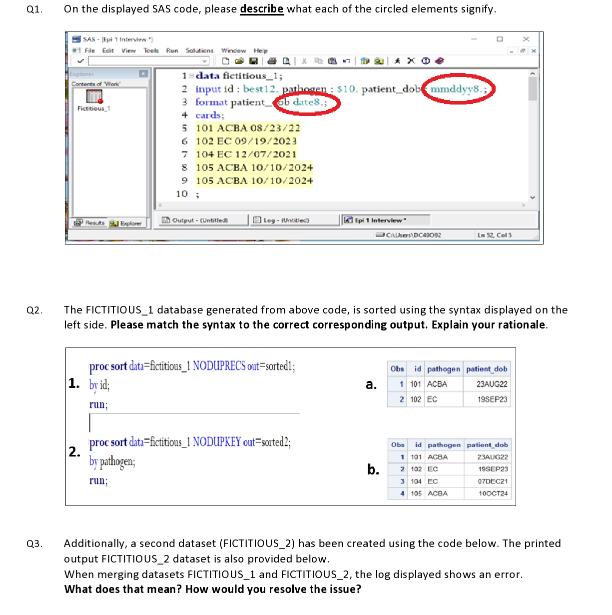
Q1. Q2. Q3. On the displayed SAS code, please describe what each of the circled elements signify. SAS Spi 1 Interview 1 File Edit


Q1. Q2. Q3. On the displayed SAS code, please describe what each of the circled elements signify. SAS Spi 1 Interview" 1 File Edit View Toels Run Solutions Window Hep Contents of W Res Explore 1sdata fictitious_1; 2 input id: best12. pathogen: $10. patient dob mmddyy8.; 3 format patient ab date8.; + cards; 2. 5 101 ACBA 08/23/22 6 102 EC 09/19/2023 7 104 EC 12/07/2021 8 105 ACBA 10/10/2024 9 105 ACBA 10/10/2024 10 Output-Untitled proc sort data-fictitions_1 NODUPRECS out-sorted!; 1. by id; run; Epi 1 Interview The FICTITIOUS 1 database generated from above code, is sorted using the syntax displayed on the left side. Please match the syntax to the correct corresponding output. Explain your rationale. proc sort data-fictitious 1 NODUPKEY out-sorted2; by pathogen; run; a. CDC43002 b. L 52, Cal Obs id pathogen patient dob 1 101 ACBA 2 102 EC Obs id pathogen 1 101 ACBA 2 102 EC 3 104 EC 4 105 ACBA 23AUG22 19SEP23 patient dob 23AUG22 19SEP23 07DEC21 100CT24 Additionally, a second dataset (FICTITIOUS_2) has been created using the code below. The printed output FICTITIOUS_2 dataset is also provided below. When merging datasets FICTITIOUS_1 and FICTITIOUS_2, the log displayed shows an error. What does that mean? How would you resolve the issue? TN Department of .Health Q4. Results SAS-Epi 1 Interview"] File Edit View Teels Run Selutions Window Hellp Results Results Log - Error SAS File Edit View Tools I Print: The SASS Print: The SASS Print: The SASS Results Explorer Results Results Print: The SAS S Print: The SAS S Print: The SAS S Print: The SAS S - Print: The SAS S Print: The SAS S Syntax 9. Explorer 13=data fictitious_2; 14 input id: $5. gender: $3. county: $10.; 15 cards; 16 101 M Davidson 17 103 F Shelby 18 104 F Hamilton 19 105 M Knox 20; 21 run; 22 Output - (Untitled) Log- (Untitled) Solutions Window Help Epi 1 Interview" 40 3 tX Epi 1 Interview VIEWTABLE: Work... Results Viewer-... 41-data merged; 42 merge fictitious_1 fictitious_2; 43 by id; 44 run; Output - (Untitled) Log - (Untitled) 122 data merged; 123 nerge fictitious 1 fictitious_2; ERROR: Variable id has been defined as both character and numeric. 124 by id; 125 run; 0.02 seconds 0.01 seconds Printed version Log - (Untitled) Obs id gender county 1 101 M Davidson 2 103 F 3 104 F 4 105 M Epi 1 Interview * NOTE: The SAS System stopped processing this step because of errors. HARNING: The data set WORK MERGED may be incomplete. When this step was stopped observations and 5 variables. NOTE: DATA statement used (Total process time): real tine cpu tine Shelby Hamilton VIEWTABLE: Work.. Knox OO Results Viewer - s... A dataset (variant_tn.csv) has the following 15 variables (Patient_Id, First_Name, Last_name, DOB, Age, Gender, PCR_result, Variant_1, Variant_2, Region, Facility, Hosp, Rep_Date, Symptom_1, Symptom_2) TN Q5. Department of Health Write a SAS or R-code to create a new dataset/dataframe (variant_tn2) with only the following variables: Patient_Id, First_Name, Last_name, DOB, Age, Gender, PCR_result, Variant_1, Variant_2 Please briefly describe the key takeaways of this visualization as you would to the public. Count of TN Population (in thousands) Vaccinations by Age Group in TN 800K 600K 400K 200K OK 467,612 101,317 187,534 135,665 200,760 187,968 428,807 442,735 329,689 270,522 489,615 514,652 227,109 115,296 602,913 614,425 79,277 72,282 64,606 68,503 12-15 16-20 21-30 31-40 41-50 51-60 74,718 61-70 No Vaccine Received Fully Vaccinated Partially Vaccinated 407,726 70,578 71-80 172,977 5-11 The plot above illustrates the percentage of people in Tennessee vaccinated with at least 1 dose by age group and the number of people in Tennessee who are partially vaccinated, fully vaccinated, and not vaccinated by age group. 81+
Step by Step Solution
There are 3 Steps involved in it
Step: 1

Get Instant Access to Expert-Tailored Solutions
See step-by-step solutions with expert insights and AI powered tools for academic success
Step: 2

Step: 3

Ace Your Homework with AI
Get the answers you need in no time with our AI-driven, step-by-step assistance
Get Started


