Answered step by step
Verified Expert Solution
Link Copied!

Question

1 Approved Answer

* To complete this exercise, you will need to have downloaded and install Tableau on your computer. Woltz Page Company (WPC) is a manufacturer that

* To complete this exercise, you will need to have downloaded and install Tableau on your computer.

Woltz Page Company (WPC) is a manufacturer that uses a job-order costing system with a plant-wide predetermined overhead rate based on direct-labor hours. Its average direct labor wage rate is $24 per hour. The company has asked you to conduct a job profitability study beginning with a thorough critique of its existing cost system. To keep the scope of your project manageable, you have chosen to base your critique on a subset of 10 jobs from the many jobs completed by the company during the year.

image text in transcribed

Questions:

1) Of the 10 jobs, which one had the highest direct materials cost (answer in the form of J1-J10)? What is the total amount?

2) Of the 10 jobs, which one had the lowest direct materials cost (answer in the form of J1-J10)? What is the total amount?

Now, create two new formulas that calculate each jobs total cost and its gross margin. After the formulas are created, generate a bar chart that shows each jobs gross margin beginning with the job that has the highest gross margin and descending to the job with the lowest gross margin.

image text in transcribedimage text in transcribed

Questions:

3) Of the 10 jobs (J1-J10), which ones had negative gross margin?

4) Of the 10 jobs, which one had the highest gross margin (answer in the form of J1-J10)? What is the total amount?

5) Of the 10 jobs, which one had the second highest gross margin (answer in the form of J1-J10)? What is the total amount?

Now, create a new formula that calculates each jobs labor intensity. (i.e., its direct labor cost divided by its sales). After you create the formula, generate a circle views chart (scatterplot) showing each jobs gross margin (depicted as a bar chart) and its labor intensity (depicted as a line chart).

image text in transcribed

Questions:

5) Of the 10 jobs, which one has the highest labor intensity?

6) Of the 10 jobs, which one has the lowest labor intensity?

7) Which of the following statements are true?

  • a) The jobs with the lowest gross margins have the lowest labor intensity.
  • b) The jobs with the lowest gross margins have the highest labor intensity.
  • c) There is a direct relationship between the jobs gross margins and their labor intensities.
  • d) There is an inverse relationship between the jobs gross margins and their labor intensities.

8) Which of the following statements are plausible interpretations of this visualization?

  • a) The companys predetermined plant-wide overhead rate is over-costing labor-intensive jobs.
  • b) The companys predetermined plant-wide overhead rate is under-costing labor-intensive jobs.
  • c) The companys existing cost system is artificially inflating the gross margins of labor-intensive jobs.
  • d) The companys existing cost system is artificially depressing the gross margins of labor-intensive jobs.
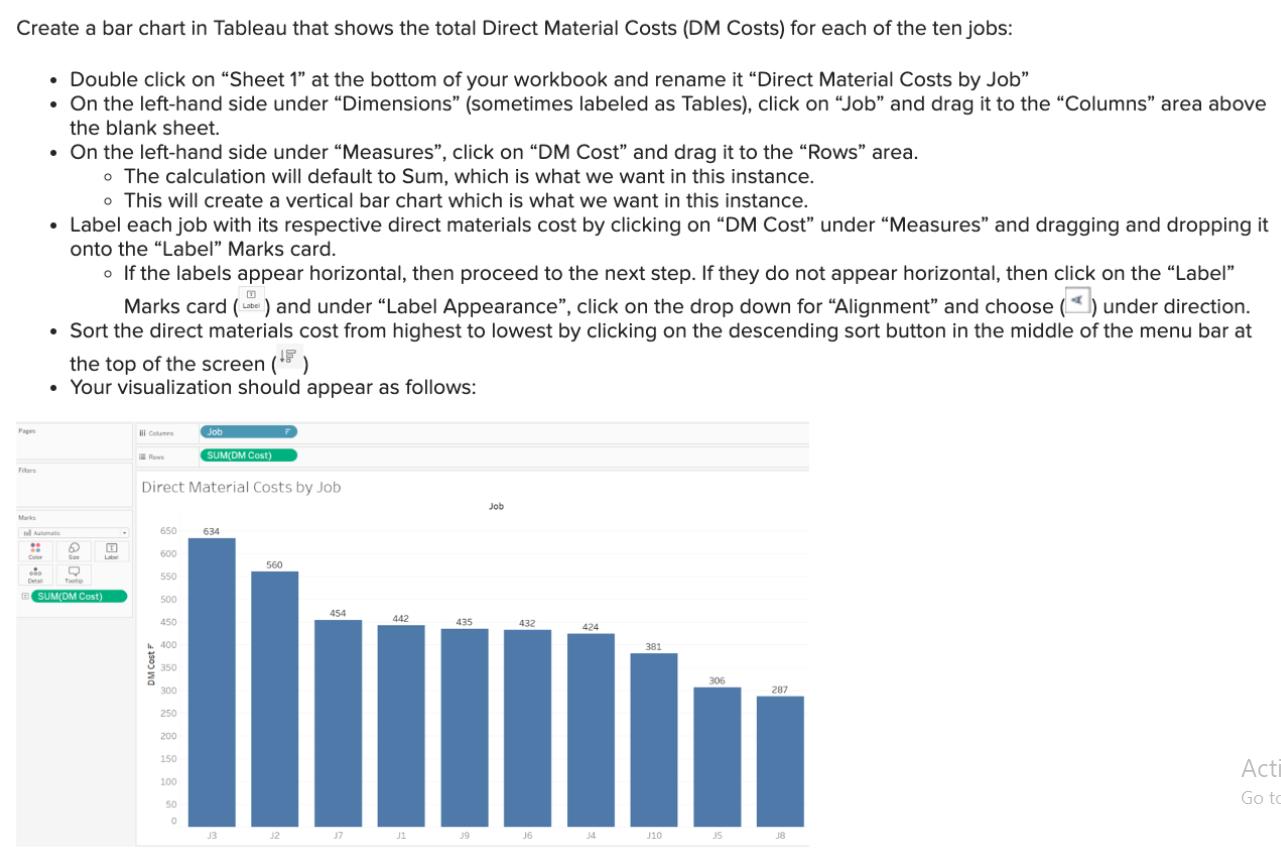
Create a bar chart in Tableau that shows the total Direct Material Costs (DM Costs) for each of the ten jobs: - Double click on "Sheet 1" at the bottom of your workbook and rename it "Direct Material Costs by Job" - On the left-hand side under "Dimensions" (sometimes labeled as Tables), click on "Job" and drag it to the "Columns" area above the blank sheet. - On the left-hand side under "Measures", click on "DM Cost" and drag it to the "Rows" area. - The calculation will default to Sum, which is what we want in this instance. - This will create a vertical bar chart which is what we want in this instance. - Label each job with its respective direct materials cost by clicking on "DM Cost" under "Measures" and dragging and dropping it onto the "Label" Marks card. - If the labels appear horizontal, then proceed to the next step. If they do not appear horizontal, then click on the "Label" Marks card ( - Sort the direct materials cost from highest to lowest by clicking on the descending sort button in the middle of the menu bar at the top of the screen (!) - Your visualization should appear as follows: - Click on the "New Worksheet" button at the bottom of your Workbook. - Double-click on the newly created "Sheet 4" at the bottom and rename it "Gross Margin by Job" - Similar to other data analysis/visualization tools, you can create calculations using your quantitative values. To create a calculated field for a new measure that captures all of the costs related to a job do the following: - Click on the "Analysis" drop-down at the top of the screen - Choose "Create Calculated Field" - A "Calculation" window will appear - Change the title of the measure from "Calculation1" to "Total Costs" - To calculate total costs, we need to add together the sum of all direct material costs, direct labor costs, and applied overhead costs. We can do this by typing in the formula for sum and then the measure name (or we can drag and drop the measure name into the window) followed by the + sign and then repeating for each of the costs. The formula will appear as follows: - SUM([DM Cost ])+SUM([DL Cost ])+SUM([ Applied OH]) - Click "OK" to close the window and save the calculation. This new calculation ("Total Cost") will show up as a new "Measure" - Next create a calculation for "Gross Margin" - Click on the "Analysis" drop-down at the top of the screen - Choose "Create Calculated Field" - A "Calculation" window will appear - Change the title of the measure from "Calculation1" to "Gross Margin" - To calculate gross margin, we need to subtract the total costs (a measure we just created) from the sum of sales. The formula will appear as follows: - SUM([Sales])-[Total Cost] - On the left-hand side under "Dimensions" (sometimes labeled as Tables) click on "Job" and drag it to the "Columns" area above the blank sheet. - On the left-hand side under "Measures", click on "Gross Margin" and drag it to the "Rows" area. - The calculation will default to Sum, which is what we want in this instance. - This will create a vertical bar chart which is what we want in this instance. - Label each job with its respective gross margin by clicking on "Gross Margin" under "Measures" and dragging and dropping it onto the "Label" Marks card. - If the labels appear horizontal, then proceed to the next step. If they do not appear horizontal, then click on the "Label" - To make it clear which jobs have a positive vs. a negative gross margin, make the jobs with a positive gross margin green and the jobs with a negative gross margin red by doing the following: - Click on "Gross Margin" under "Measures" and drag and drop it onto the "Colors" Marks card - Next click on the "Colors" Marks card and select "Edit Colors" - Check the box next to "Stepped Color" and modify the steps to 2 - Click on the left color square and change it to a red color and then click on the right color square and change it to a green color (another good option that avoids concerns related to color blindness would be to use orange for negative and blue for positive) - Finally click the "F in Rows Filters C - Click on the "New Worksheet" button at the bottom of your Workbook. - Double-click on the newly created "Sheet 5" at the bottom and rename it "Gross Margin v. Labor Intensity by Job" - To calculate each job's labor intensity do the following: - Click on the "Analysis" drop-down at the top of the screen - Choose "Create Calculated Field" - A "Calculation" window will appear - Change the title of the measure from "Calculation1" to "Labor Intensity" - To calculate labor intensity, we need to divide the sum of direct labor costs by the sum of sales. The formula will appear as follows: - SUM([DL Cost ])/SUM([ Sales] ) - Click "OK" to close the window and save the calculation. This new calculation ("Labor Intensity") will show up as a new "Measure" - On the left-hand side under "Dimensions" click on and drag "Jobs" into columns - On the left-hand side under "Measures" (sometimes labeled as Tables) click on "Gross Margin" and drag it to the "Rows" area above the blank sheet. - On the left-hand side under "Measures" (sometimes labeled as Tables) click on "Labor Intensity" and drag it to the "Rows" area beside "Gross Margin" - Sort the bar chart from highest to lowest amount by clicking on the descending sort button in the middle of the menu bar at the top of the screen ( ) - Once "Labor Intensity" is in rows, click on the "Agg(Labor Intensity)" pill dropdown and choose "Dual Axis" - Now under the "Marks" card section you should see three sub-headers "All", "AGG(Gross Margin)", and "AGG(Labor Intensity)" - Click on the "AGG(Gross Margin)" sub header and select the drop down that says automatic, and modify the selection to "Bar" - Click on the "AGG(Labor Intensity)" sub header and select the drop down that says automatic, and modify the selection to "Line" - While still on the "AGG(Labor Intensity)" sub header, click on the "Color" marks card and choose "Edit Colors" and choose orange to improve line's visibility - To improve viewing, locate the "Standard" dropdown option in the menu bar at the top of the screen. Click on that dropdown and choose "Entire View." - Your visualization should appear as follows

Step by Step Solution

There are 3 Steps involved in it

Step: 1

blur-text-image

Get Instant Access to Expert-Tailored Solutions

See step-by-step solutions with expert insights and AI powered tools for academic success

Step: 2

blur-text-image

Step: 3

blur-text-image

Ace Your Homework with AI

Get the answers you need in no time with our AI-driven, step-by-step assistance

Get Started

Recommended Textbook for

Financial Accounting

Authors: Alan Melville

2nd Edition

0273634399, 978-0273634393

More Books

Students also viewed these Accounting questions

Question

What is meant by formal organisation ?

Answered: 1 week ago

Question

What is meant by staff authority ?

Answered: 1 week ago

Question

Discuss the various types of policies ?

Answered: 1 week ago

Question

Briefly explain the various types of leadership ?

Answered: 1 week ago

Question

=+7. What is the big message you want them to know?

Answered: 1 week ago