Question
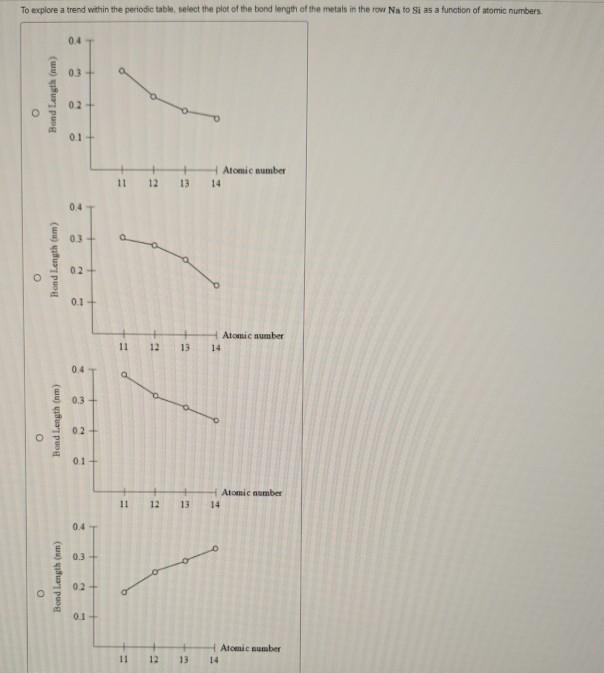
To explore a trend within the periodic table, select the plot of the bond length of the metals in the row Na to Si

To explore a trend within the periodic table, select the plot of the bond length of the metals in the row Na to Si as a function of atomic numbers 0.4 0.3+ 02+ 01+ H Atomic number 14 11 12 13 0.4 03+ 02 0.1 Atomic number 11 12 13 14 0.4 a. 0.3 02 01+ Atomic aumber 11 12 13 14 0.4 0.3+ 02 HAtomic number 11 12 13 14 Bond Length (nm) Bond Length (nm) Bond Length (nm) (uu) tur pung %3D
Step by Step Solution
3.59 Rating (156 Votes )
There are 3 Steps involved in it
Step: 1

Get Instant Access to Expert-Tailored Solutions
See step-by-step solutions with expert insights and AI powered tools for academic success
Step: 2

Step: 3

Ace Your Homework with AI
Get the answers you need in no time with our AI-driven, step-by-step assistance
Get StartedRecommended Textbook for
Chemical Principles
Authors: Steven S. Zumdahl, Donald J. DeCoste
7th edition
9781133109235, 1111580650, 978-1111580650
Students also viewed these Chemical Engineering questions
Question
Answered: 1 week ago
Question
Answered: 1 week ago
Question
Answered: 1 week ago
Question
Answered: 1 week ago
Question
Answered: 1 week ago
Question
Answered: 1 week ago
Question
Answered: 1 week ago
Question
Answered: 1 week ago
Question
Answered: 1 week ago
Question
Answered: 1 week ago
Question
Answered: 1 week ago
Question
Answered: 1 week ago
Question
Answered: 1 week ago
Question
Answered: 1 week ago
Question
Answered: 1 week ago
Question
Answered: 1 week ago
Question
Answered: 1 week ago
Question
Answered: 1 week ago
Question
Answered: 1 week ago
Question
Answered: 1 week ago
View Answer in SolutionInn App


