Answered step by step
Verified Expert Solution
Question
1 Approved Answer
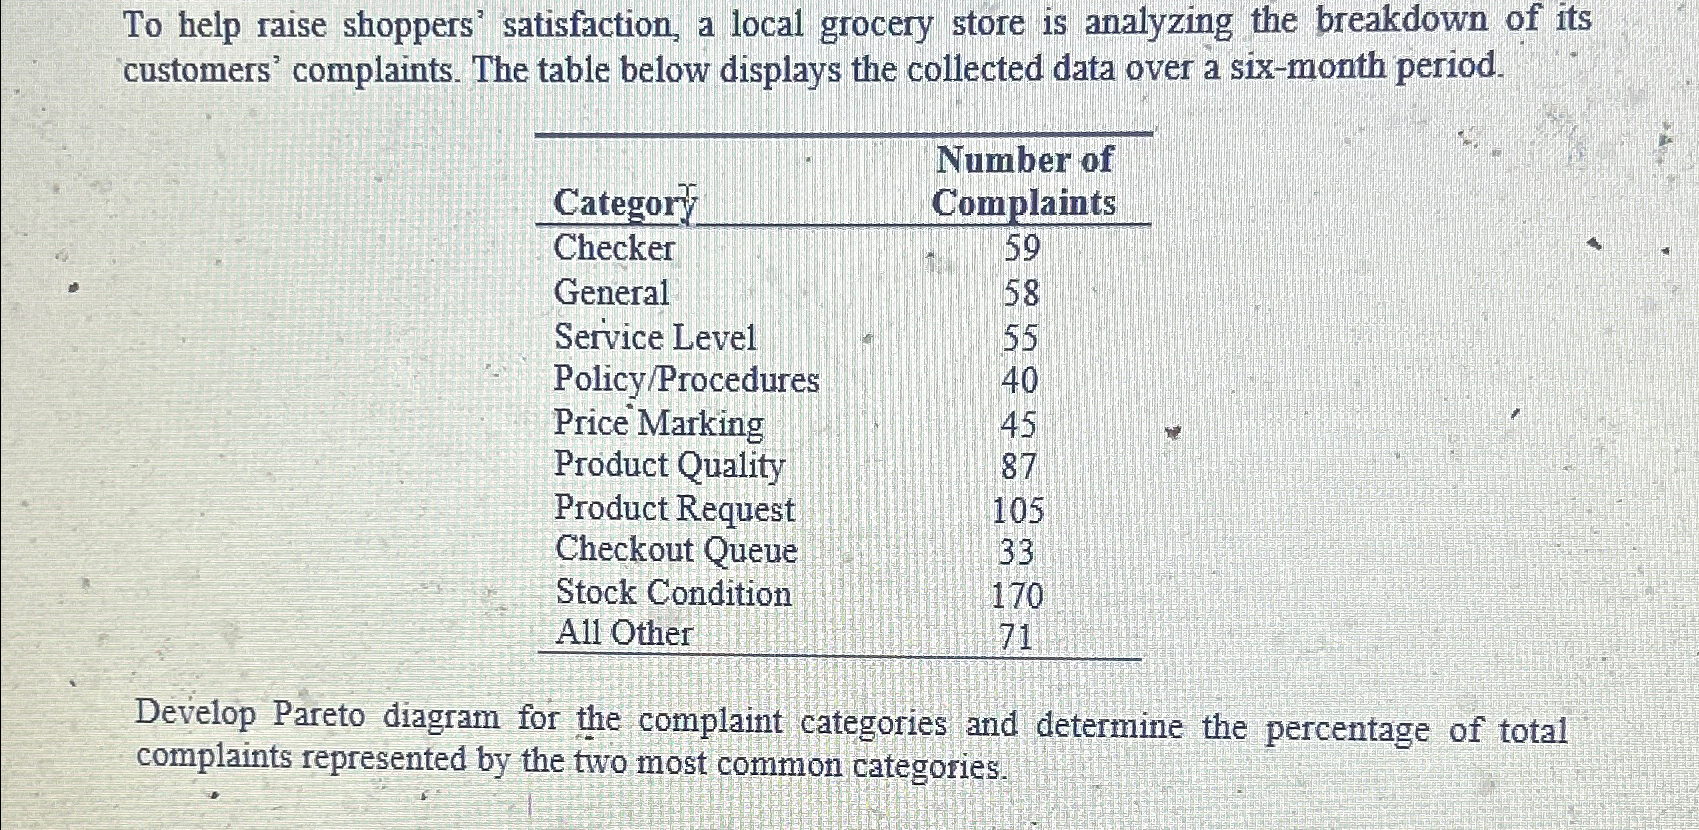
To help raise shoppers' satisfaction, a local grocery store is analyzing the breakdown of its customers' complaints. The table below displays the collected data over
To help raise shoppers' satisfaction, a local grocery store is analyzing the breakdown of its customers' complaints. The table below displays the collected data over a sixmonth period.
tableCategorytableNumber ofComplaintsCheckerGeneralService Level,PolicyProceduresPrice Marking,Product Quality,Product Request,Checkout Queue,Stock Condition,All Other,
Develop Pareto diagram for the complaint categories and determine the percentage of total complaints represented by the two most common categories.

Step by Step Solution
There are 3 Steps involved in it
Step: 1

Get Instant Access to Expert-Tailored Solutions
See step-by-step solutions with expert insights and AI powered tools for academic success
Step: 2

Step: 3

Ace Your Homework with AI
Get the answers you need in no time with our AI-driven, step-by-step assistance
Get Started


