Answered step by step
Verified Expert Solution
Question
1 Approved Answer
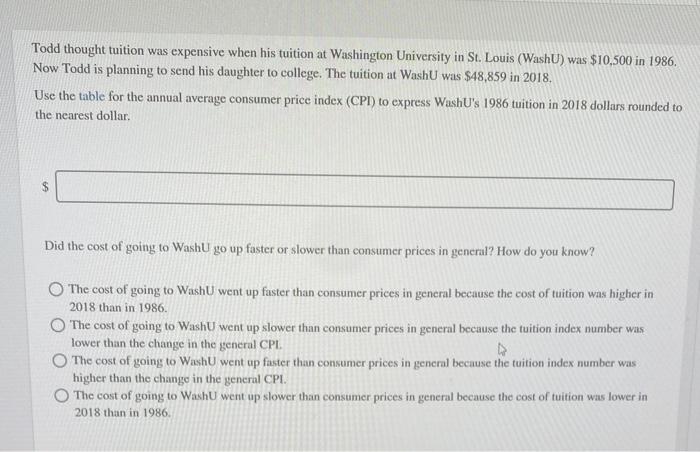
Todd thought tuition was expensive when his tuition at Washington University in St. Louis (WashU) was $10,500 in 1986. Now Todd is planning to


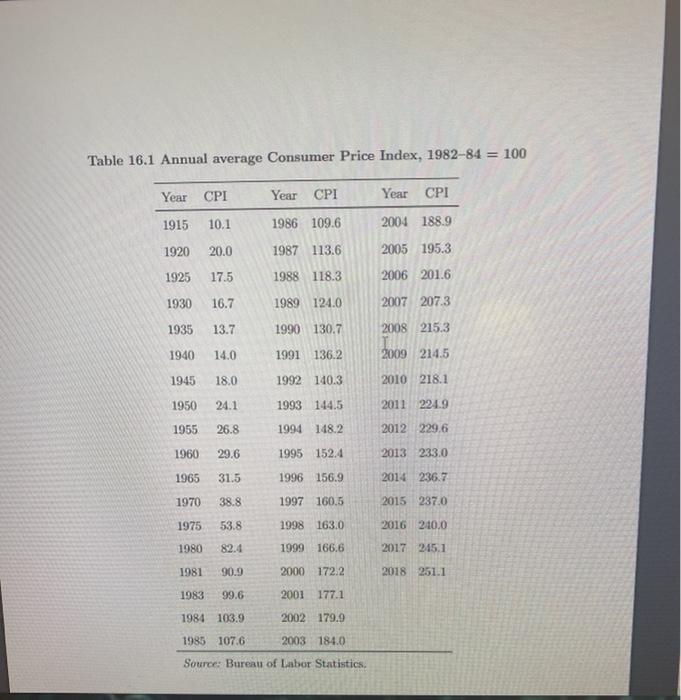
Todd thought tuition was expensive when his tuition at Washington University in St. Louis (WashU) was $10,500 in 1986. Now Todd is planning to send his daughter to college. The tuition at WashU was $48,859 in 2018. Use the table for the annual average consumer price index (CPI) to express WashU's 1986 tuition in 2018 dollars rounded to the nearest dollar. Did the cost of going to WashU go up faster or slower than consumer prices in general? How do y you know? The cost of going to WashU went up faster than consumer prices in general because the cost of tuition was higher in 2018 than in 1986. The cost of going to WashU went up slower than consumer prices in general because the tuition index number was lower than the change in the general CPI. O The cost of going to WashU went up faster than consumer prices in general because the tuition index number was higher than the change in the general CPI. The cost of going to WashU went up slower than consumer prices in general because the cost of tuition was lower in 2018 than in 1986. Table 16.1 Annual average Consumer Price Index, 1982-84 = 100 Year CPI 1915 10.1 1920 20.0 1925 17.5 1930 16.7 1935 13.7 1940 14.0 1945 18.0 1950 24.1 1955. 26.8 1960 29.6 1965 31.5 1970 38.8 1975 53.8 1980 82.4 1981 90.9 1983 99.6 1984 103.9 1985 107.6 Year CPI 1986 109.6 1987 113.6 1988 118.3 1989 124.0 1990 130.7 1991 136.2 1992 140.3 1993 144.5 1994 148.2 1995 152.4 1996 156.9 1997 160.5 1998 163.0 1999 166.6 2000 172.2 2001 177.1 2002 179.9 2003 184.0 Source: Bureau of Labor Statistics. Year CPI 2004 188.9 2005 195.3 2006 201.6 2007 207.3 2008 215.3 2009 214.5 2010 218.1 2011 224.9 2012 229.6 2013 233.0 2014 236.7 2015 237.0 2016 240.0 2017 245.1 2018 251.1
Step by Step Solution
★★★★★
3.34 Rating (148 Votes )
There are 3 Steps involved in it
Step: 1

Get Instant Access to Expert-Tailored Solutions
See step-by-step solutions with expert insights and AI powered tools for academic success
Step: 2

Step: 3

Ace Your Homework with AI
Get the answers you need in no time with our AI-driven, step-by-step assistance
Get Started


