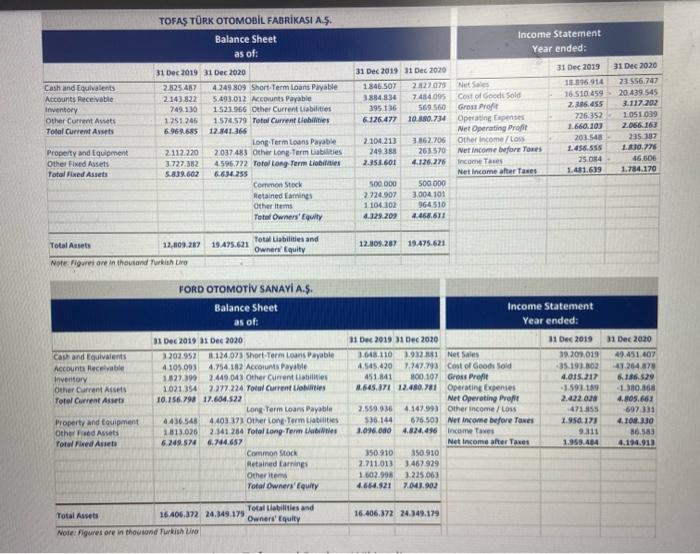
TOFA TRK OTOMOBL FABRKASI A.S. Balance Sheet as of: Income Statement Year ended: Cash and Equivalent Accounts Receivable Inventory Other Current Assets Total Current Assets 31 Dec 2019 31 Dec 2020 2825 457 4 249 809 Short Term Loans Payable 2.143 822 5.493,012 Accounts Payable 749.130 1523066 Other Current liabilities 1.251245 1574.579 Total Current Liabilities 6.969.685 12.341.366 Long Term Loans Payable 2112220 2037.483 Other Long Term Liabilities 3727.382 4.596.772 Total Long Term Liabilities 5.839.602 6.614.255 Common Stock Retained in Other items Total Owners' Equity 31 Dec 2019 31 Dec 2020 1846.50 2.23079 Net Sale 3884834 7484.095 Cost of Goods Sold 395 136 569.560 Gross Profit 6.126.477 10.180.734 Operating penses Net Operating profil 2.104.213 3.162.706 Other income/los 349 350 263570 Net income before Tones 2.351.601 4.126.276 Income Tas Net Income after Taxes 500 DOO 500 000 2.724907 3004101 1104302 964510 329.209 4.468.611 31 Dec 2019 196914 16.510 459 2.386.455 726-352 1.660.103 203 548 1.456.555 25 24 1.481.619 31 Dec 2020 23 556.747 20.439 545 3.117.202 1.051039 2.066.163 235 187 100 Hi 46 606 1.784.170 Property and Equipment Other Fixed Assets Total Fixed Assets Total Liabilities and Owners Equity 12.809287 Total Assets 12,809.217 19 A5.621 Note: Figures are in thousand Turkish Lira 19475621 FORD OTOMOTV SANAYI A.S. Balance Sheet as of: Income Statement Year ended: Cash and Equivalent Accounts Receivable Inventory Other Current Assets Total Current Assets 31 Dec 2019 31 Dec 2020 3.202.952124.023 Short Term Loans Payable 4105093 4.754.102 Accounts Payable 1.327.39 2.449 043 Other Current abilities 1021 354 2.277 224 Total Current Liettes 10.156.798 17.634.522 Long Term Loans Payable 4436 545 4.403371 Other Long Term Liabilities 1813.0262.141 264 Total Long Term Cables 6.249.524 6.744.657 Common Stock Retained arrin Other item Total Owners' Equity 11 Dec 2019 31 Dec 2010 1.048 110 3.932.81 Net Sales 4.545420 7.747.793 Cost of Goods Sold 451 841 800.107 Gross Profit 8.645.371 12.480.781 Operating expenses Net Operating Profile 2.559.036 4.147.99) Other income LOSS 536.144 676503 Net Income before Tones 3.096.000 4.824.496 Income Taxes Net Income after Taxes 350 910 350.910 2.711013 3.467929 1602.900 1.215.063 4.664.921 7.041.902 31 Dec 2019 31 Dec 2020 39.200.019 49.451 407 35.193.802 43.264 870 4.015.217 6186.529 -1.591 109 1380.168 2.422.028 4.805.661 47155 -69733 1.950.173 4.10 3.30 9.311 36,583 1.953.484 4.194.913 Property and Equipment Othered Assets Tor Fixed Asset 16.406.372 24.349.179 Total abilities and Total Asset 16406,372 24.149.179 Owners' Equity Note: Figures ore in thousand Turkish Requirements: Perform the ratio analysis for both Tofa and Ford. 1. Calculate profitability, liquidity, activity and leverage ratios for both 2019 and 2020. The ratios are explained in Chapter 15 of Bovee & Thill. You are not required to calculate "earnings per share". 2. How did the ratios change for Ford from 2019 to 2020? 3. How did the ratios change for Tofa from 2019 to 2020? 4. Compare the ratios of Ford and Tofa for the year 2020 and comment on which one has performed better regarding each ratio. Submission: Each group should submit the following: 1. An excel file with 3 sheets: a. Sheet 1: Ratios of Tofa for years 2019 and 2020 b. Sheet 2: Ratios of Ford for years 2019 and 2020 c. Sheet 3: Ratios of Ford and Tofa for the year 2020 2. A word file in which you present a discussion of the topics under requirements 2, 3 and 4. You should also copy the excel sheets (sheet 1, sheet 2 and sheet 3) into the Word document. One person from each group should upload the Word file onto Turnitin Assignments 3. Also send the excel file to me via e-mail as soon as you finish the in-class activity. TOFA TRK OTOMOBL FABRKASI A.S. Balance Sheet as of: Income Statement Year ended: Cash and Equivalent Accounts Receivable Inventory Other Current Assets Total Current Assets 31 Dec 2019 31 Dec 2020 2825 457 4 249 809 Short Term Loans Payable 2.143 822 5.493,012 Accounts Payable 749.130 1523066 Other Current liabilities 1.251245 1574.579 Total Current Liabilities 6.969.685 12.341.366 Long Term Loans Payable 2112220 2037.483 Other Long Term Liabilities 3727.382 4.596.772 Total Long Term Liabilities 5.839.602 6.614.255 Common Stock Retained in Other items Total Owners' Equity 31 Dec 2019 31 Dec 2020 1846.50 2.23079 Net Sale 3884834 7484.095 Cost of Goods Sold 395 136 569.560 Gross Profit 6.126.477 10.180.734 Operating penses Net Operating profil 2.104.213 3.162.706 Other income/los 349 350 263570 Net income before Tones 2.351.601 4.126.276 Income Tas Net Income after Taxes 500 DOO 500 000 2.724907 3004101 1104302 964510 329.209 4.468.611 31 Dec 2019 196914 16.510 459 2.386.455 726-352 1.660.103 203 548 1.456.555 25 24 1.481.619 31 Dec 2020 23 556.747 20.439 545 3.117.202 1.051039 2.066.163 235 187 100 Hi 46 606 1.784.170 Property and Equipment Other Fixed Assets Total Fixed Assets Total Liabilities and Owners Equity 12.809287 Total Assets 12,809.217 19 A5.621 Note: Figures are in thousand Turkish Lira 19475621 FORD OTOMOTV SANAYI A.S. Balance Sheet as of: Income Statement Year ended: Cash and Equivalent Accounts Receivable Inventory Other Current Assets Total Current Assets 31 Dec 2019 31 Dec 2020 3.202.952124.023 Short Term Loans Payable 4105093 4.754.102 Accounts Payable 1.327.39 2.449 043 Other Current abilities 1021 354 2.277 224 Total Current Liettes 10.156.798 17.634.522 Long Term Loans Payable 4436 545 4.403371 Other Long Term Liabilities 1813.0262.141 264 Total Long Term Cables 6.249.524 6.744.657 Common Stock Retained arrin Other item Total Owners' Equity 11 Dec 2019 31 Dec 2010 1.048 110 3.932.81 Net Sales 4.545420 7.747.793 Cost of Goods Sold 451 841 800.107 Gross Profit 8.645.371 12.480.781 Operating expenses Net Operating Profile 2.559.036 4.147.99) Other income LOSS 536.144 676503 Net Income before Tones 3.096.000 4.824.496 Income Taxes Net Income after Taxes 350 910 350.910 2.711013 3.467929 1602.900 1.215.063 4.664.921 7.041.902 31 Dec 2019 31 Dec 2020 39.200.019 49.451 407 35.193.802 43.264 870 4.015.217 6186.529 -1.591 109 1380.168 2.422.028 4.805.661 47155 -69733 1.950.173 4.10 3.30 9.311 36,583 1.953.484 4.194.913 Property and Equipment Othered Assets Tor Fixed Asset 16.406.372 24.349.179 Total abilities and Total Asset 16406,372 24.149.179 Owners' Equity Note: Figures ore in thousand Turkish Requirements: Perform the ratio analysis for both Tofa and Ford. 1. Calculate profitability, liquidity, activity and leverage ratios for both 2019 and 2020. The ratios are explained in Chapter 15 of Bovee & Thill. You are not required to calculate "earnings per share". 2. How did the ratios change for Ford from 2019 to 2020? 3. How did the ratios change for Tofa from 2019 to 2020? 4. Compare the ratios of Ford and Tofa for the year 2020 and comment on which one has performed better regarding each ratio. Submission: Each group should submit the following: 1. An excel file with 3 sheets: a. Sheet 1: Ratios of Tofa for years 2019 and 2020 b. Sheet 2: Ratios of Ford for years 2019 and 2020 c. Sheet 3: Ratios of Ford and Tofa for the year 2020 2. A word file in which you present a discussion of the topics under requirements 2, 3 and 4. You should also copy the excel sheets (sheet 1, sheet 2 and sheet 3) into the Word document. One person from each group should upload the Word file onto Turnitin Assignments 3. Also send the excel file to me via e-mail as soon as you finish the in-class activity