Answered step by step
Verified Expert Solution
Question
1 Approved Answer
Tonia and Tara have realized that they will be able to better analyze their profitability and cost structure by converting their pro forma income
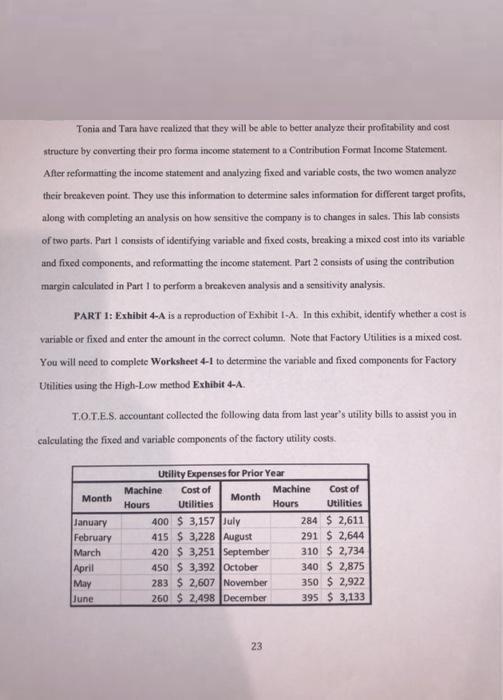
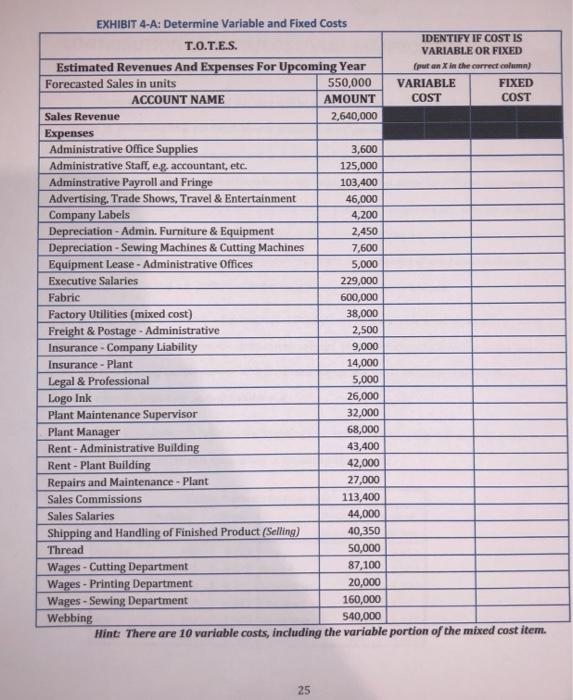
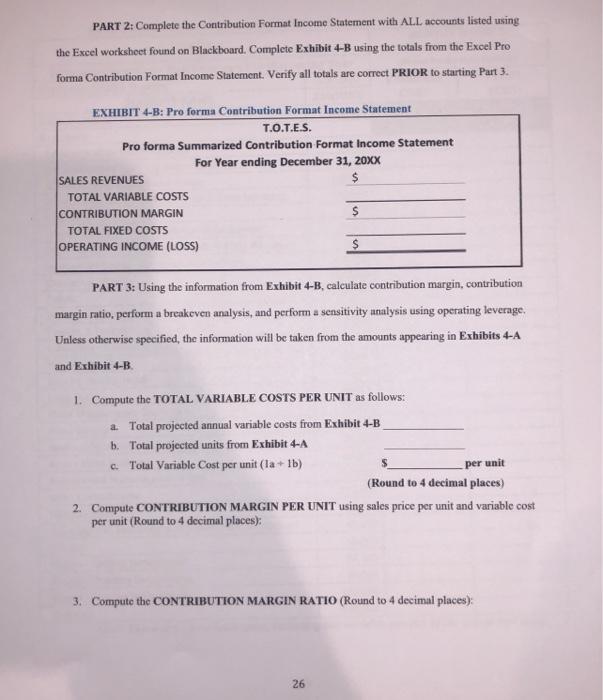
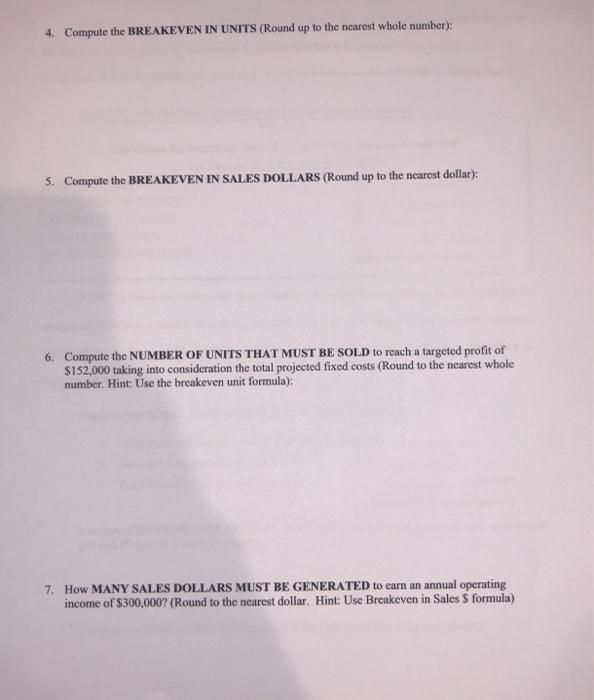
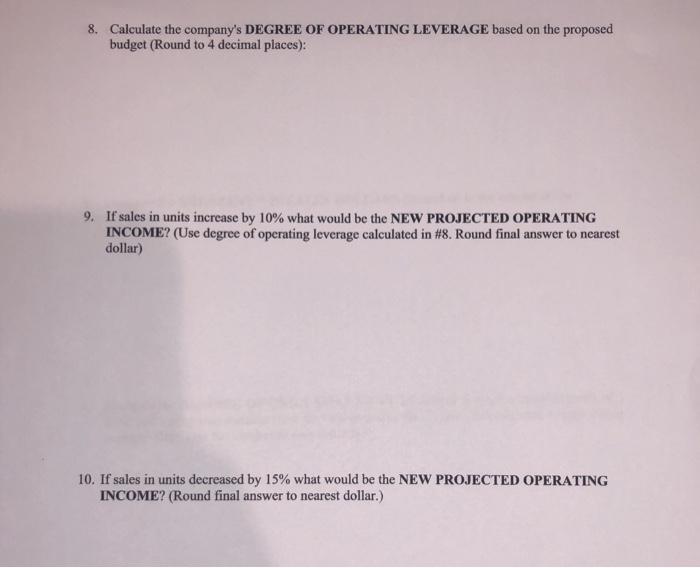
Tonia and Tara have realized that they will be able to better analyze their profitability and cost structure by converting their pro forma income statement to a Contribution Format Income Statement. After reformatting the income statement and analyzing fixed and variable costs, the two women analyze their breakeven point. They use this information to determine sales information for different target profits, along with completing an analysis on bow sensitive the company is to changes in sales. This lab consists of two parts. Part l consists of identifying variable and fixed costs, breaking a mixed cost into its variable and fixed components, and reformatting the income statement. Part 2 consists of using the contribution margin calculated in Part 1 to perform a breakeven analysis and a sensitivity analysis. PART 1: Exhibit 4-A is a reproduction of Exhibit I-A. In this exhibit, identify whether a cost is variable or fixed and enter the amount in the correct column. Note that Factory Utilities is a mixed cost. You will need to complete Worksheet 4-1 to determine the variable and fixed components for Factory Utilities using the High-Low method Exhibit 4-A. T.O.T.E.S. accountant collected the following data from last year's utility bills to assist you in calculating the fixed and variable components of the factory utility costs. Utility Expenses for Prior Year Machine Cost of Machine Cost of Month Month Hours Utilities Hours Utilities 400 $ 3,157 July 415 $ 3,228 August 420 $ 3,251September 450 $ 3,392October 283 $ 2,607 November 260 $ 2,498December 284 $ 2,611 January February March 291 $ 2,644 310 $ 2,734 April May June 340 $ 2,875 350 $ 2,922 395 $ 3,133 23 EXHIBIT 4-A: Determine Variable and Fixed Costs IDENTIFY IF COST IS VARIABLE OR FIXED T.O.T.E.S. Estimated Revenues And Expenses For Upcoming Year 550,000 (put an X in the correct column) FIXED COST Forecasted Sales in units VARIABLE ACCOUNT NAME AMOUNT COST Sales Revenue 2,640,000 Expenses Administrative Office Supplies Administrative Staff, eg, accountant, etc. 3,600 125,000 Adminstrative Payroll and Fringe Advertising. Trade Shows, Travel & Entertainment 103,400 46,000 Company Labels Depreciation - Admin. Furniture & Equipment Depreciation - Sewing Machines & Cutting Machines Equipment Lease - Administrative Offices 4,200 2,450 7,600 5,000 Executive Salaries 229,000 Fabric 600,000 Factory Utilities (mixed cost) Freight & Postage - Administrative Insurance - Company Liability 38,000 2,500 9,000 14,000 Insurance - Plant Legal & Professional Logo Ink Plant Maintenance Supervisor 5,000 26,000 32,000 68,000 Plant Manager Rent - Administrative Building 43,400 42,000 Rent - Plant Building Repairs and Maintenance - Plant 27,000 113,400 Sales Commissions Sales Salaries 44,000 Shipping and Handling of Finished Product (Selling) 40,350 Thread 50,000 87,100 Wages - Cutting Department Wages - Printing Department Wages - Sewing Department 20,000 160,000 Webbing 540,000 Hint: There are 10 variable costs, including the variable portion of the mixed cost item. 25 PART 2: Complete the Contribution Format Income Statement with ALL accounts listed using the Excel worksheet found on Blackboard. Complete Exhibit 4-B using the totals from the Excel Pro forma Contribution Format Income Statement. Verify all totals are correct PRIOR to starting Part 3. EXHIBIT 4-B: Pro forma Contribution Format Income Statement T.O.T.E.S. Pro forma Summarized Contribution Format Income Statement For Year ending December 31, 20XX SALES REVENUES TOTAL VARIABLE COSTS CONTRIBUTION MARGIN TOTAL FIXED COSTS OPERATING INCOME (LOSS) PART 3: Using the information from Exhibit 4-B, calculate contribution margin, contribution margin ratio, perform a breakeven analysis, and perform a sensitivity analysis using operating leverage. Unless otherwise specified, the information will be taken from the amounts appearing in Exhibits 4-A and Exhibit 4-B. 1. Compute the TOTAL VARIABLE COSTS PER UNIT as follows: a. Total projected annual variable costs from Exhibit 4-B b. Total projected units from Exhibit 4-A c. Total Variable Cost per unit (la + Ib) per unit (Round to 4 decimal places) 2. Compute CONTRIBUTION MARGIN PER UNIT using sales price per unit and variable cost per unit (Round to 4 decimal places): 3. Compute the CONTRIBUTION MARGIN RATIO (Round to 4 decimal places): 26 4. Compute the BREAKEVEN IN UNITS (Round up to the nearest whole number): 5. Compute the BREAKEVEN IN SALES DOLLARS (Round up to the nearest dollar): 6. Compute the NUMBER OF UNITS THAT MUST BE SOLD to reach a targeted profit of $152,000 taking into consideration the total projected fixed costs (Round to the nearest whole number. Hint: Use the breakeven unit formula): 7. How MANY SALES DOLLARS MUST BE GENERATED to carn an annual operating income of $300,000? (Round to the nearest dollar. Hint: Use Breakeven in Sales $ formula) 8. Calculate the company's DEGREE OF OPERATING LEVERAGE based on the proposed budget (Round to 4 decimal places): 9. If sales in units increase by 10% what would be the NEW PROJECTED OPERATING INCOME? (Use degree of operating leverage calculated in #8. Round final answer to nearest dollar) 10. If sales in units decreased by 15% what would be the NEW PROJECTED OPERATING INCOME? (Round final answer to nearest dollar.)
Step by Step Solution
★★★★★
3.40 Rating (163 Votes )
There are 3 Steps involved in it
Step: 1
Answer Solution Exhibit 4A Account name Amount Variable Cost Fixed Cost Sales Revenue 264000000 Expenses Administrative office supplies 360000 360000 Administrative staff egaccountant etc 12500000 125...
Get Instant Access to Expert-Tailored Solutions
See step-by-step solutions with expert insights and AI powered tools for academic success
Step: 2

Step: 3

Ace Your Homework with AI
Get the answers you need in no time with our AI-driven, step-by-step assistance
Get Started


