Answered step by step
Verified Expert Solution
Link Copied!

Question

1 Approved Answer

total amount paid on interest. 2. The following data are expected to follow a quadratic relationship. X 0.1 10 100 1000 y 3.667 3.724 4.223
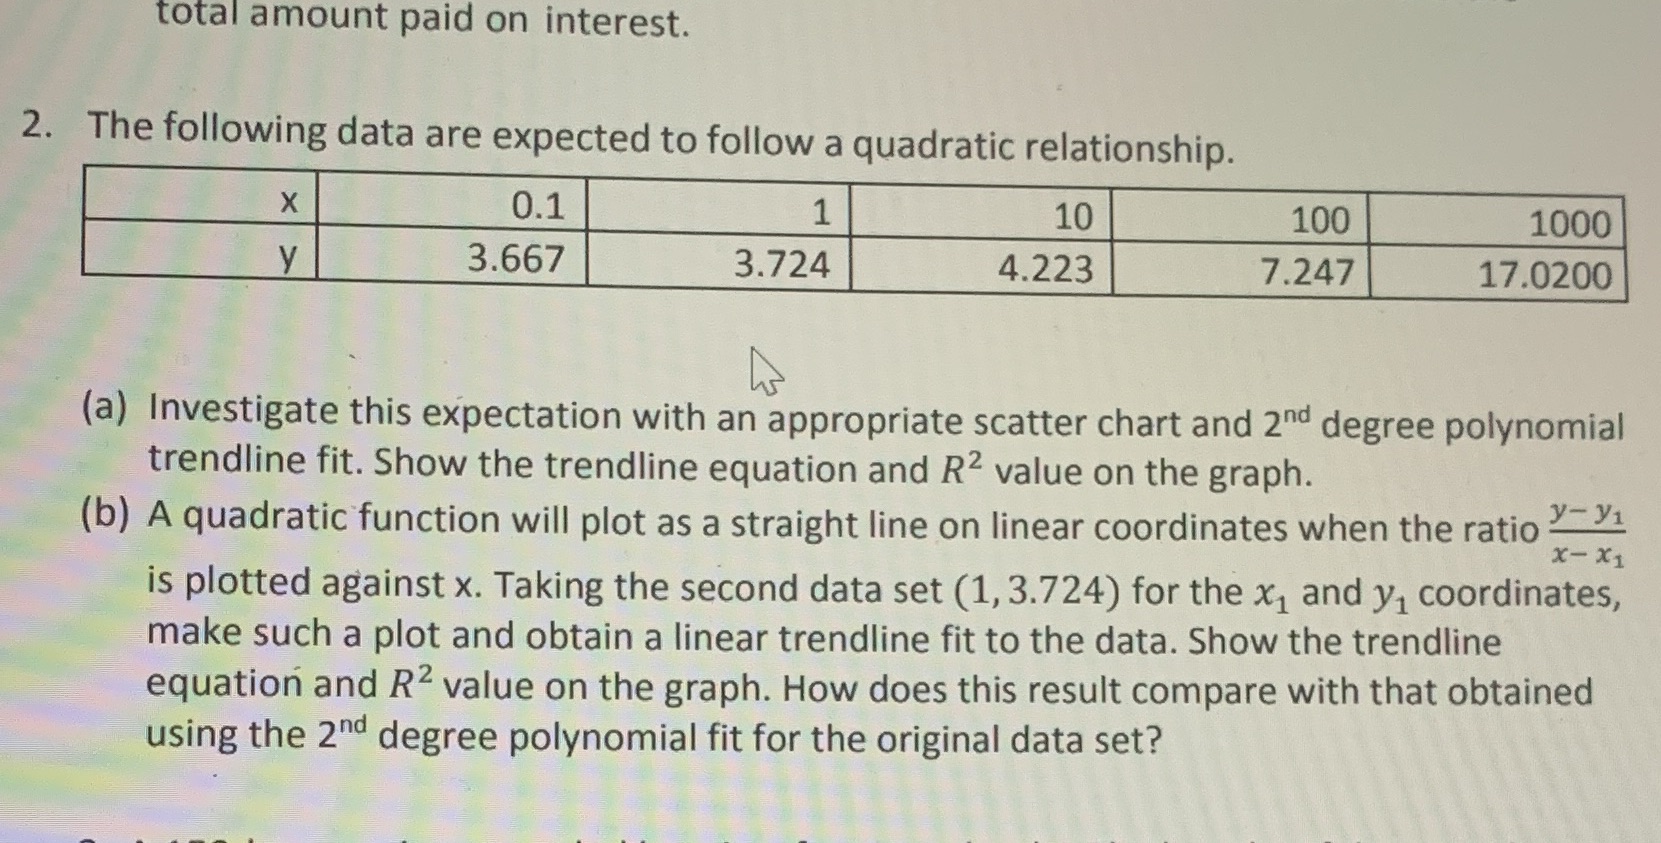
image text in transcribed
total amount paid on interest. 2. The following data are expected to follow a quadratic relationship. X 0.1 10 100 1000 y 3.667 3.724 4.223 7.247 17.0200 (a) Investigate this expectation with an appropriate scatter chart and 2nd degree polynomial trendline fit. Show the trendline equation and R2 value on the graph. (b) A quadratic function will plot as a straight line on linear coordinates when the ratio y- y1 x- X1 is plotted against x. Taking the second data set (1, 3.724) for the x, and y, coordinates, make such a plot and obtain a linear trendline fit to the data. Show the trendline equation and R2 value on the graph. How does this result compare with that obtained using the 2nd degree polynomial fit for the original data set

Step by Step Solution

There are 3 Steps involved in it

Step: 1

blur-text-image

Get Instant Access to Expert-Tailored Solutions

See step-by-step solutions with expert insights and AI powered tools for academic success

Step: 2

blur-text-image_2

Step: 3

blur-text-image_3

Ace Your Homework with AI

Get the answers you need in no time with our AI-driven, step-by-step assistance

Get Started

Recommended Textbook for

Advanced Calculus

Authors: R Creighton Buck

3rd Edition

147861613X, 9781478616139

More Books

Students also viewed these Mathematics questions

Question

Five ways you can use place strategy to help priority audience

Answered: 1 week ago

Question

What are Electrophoresis?

Answered: 1 week ago

Question

8. Explain the relationship between communication and context.

Answered: 1 week ago