Total Annual Demand Inputs 690617 All parts Holding cost, H = 0.15 per unit and day 165820 Part 7 L costs from plants to DCs
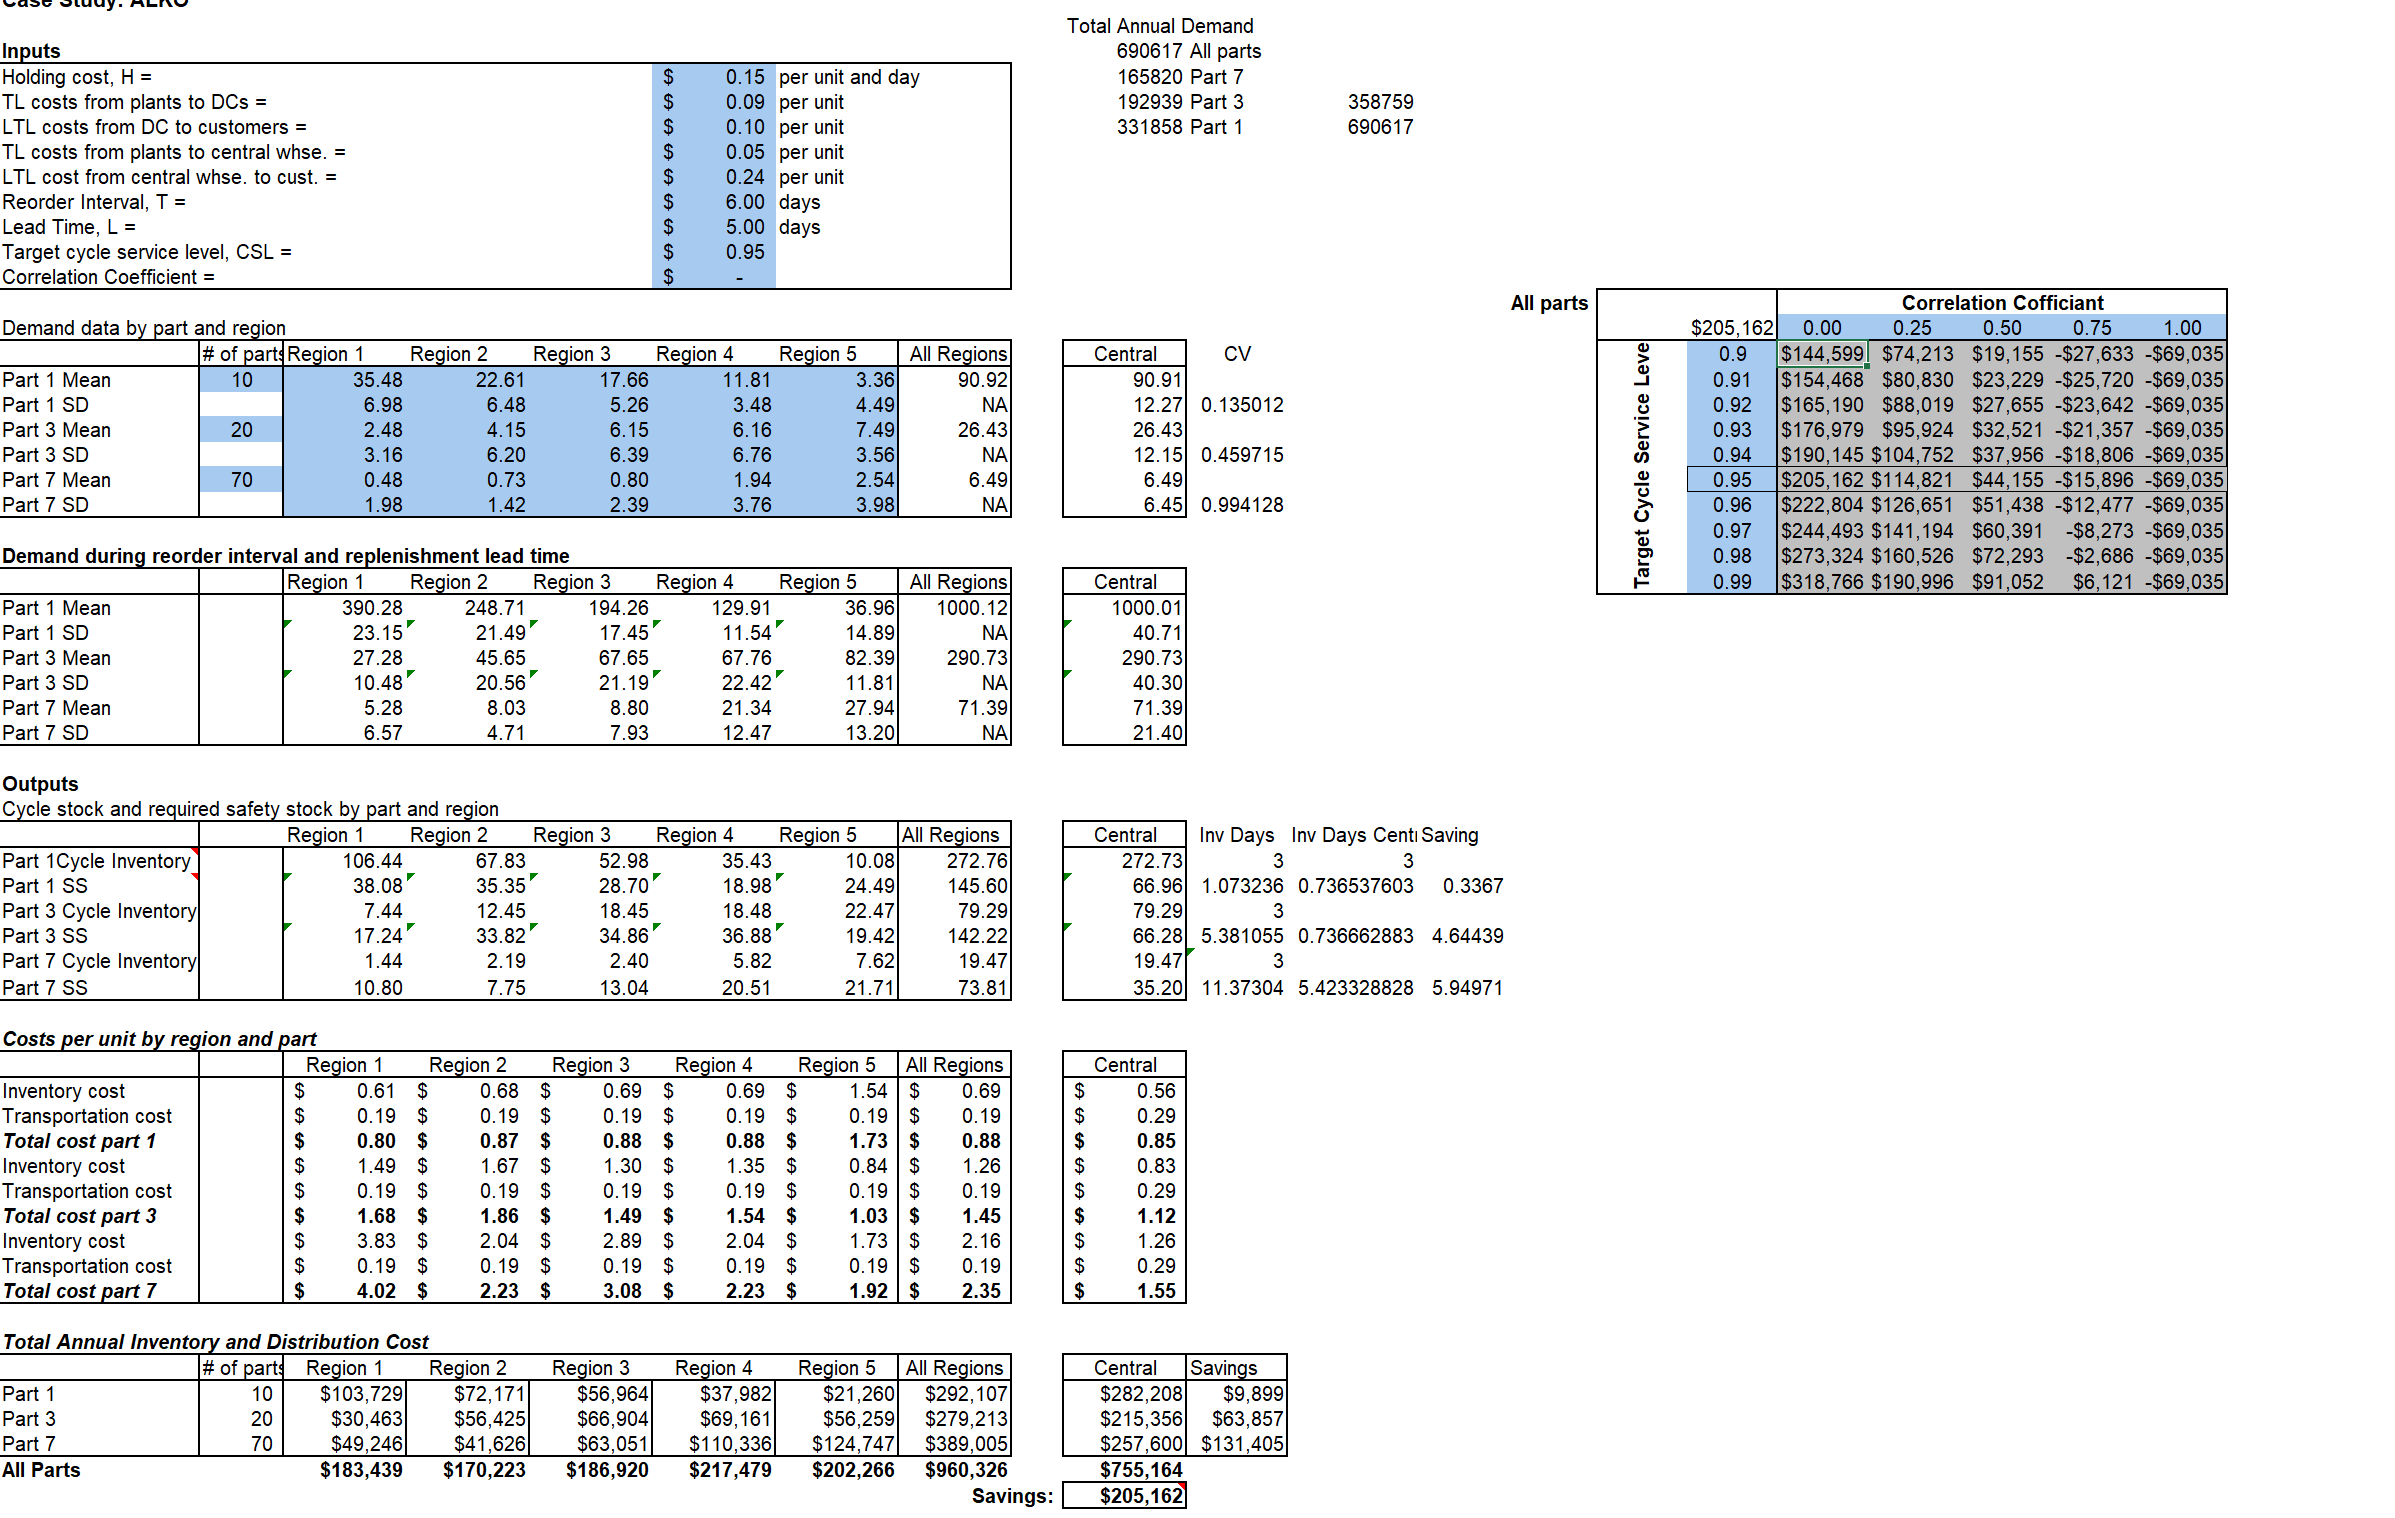
Total Annual Demand Inputs 690617 All parts Holding cost, H = 0.15 per unit and day 165820 Part 7 L costs from plants to DCs = 0.09 per un 192939 Part 3 358759 LTL costs from DC to customers = 0.10 per unit 331858 Part 1 690617 TL costs from plants to central whse. = 0.05 per unit LTL cost from central whse. to cust. = 0.24 per unit Reorder Interval, T = 6.00 days Lead Time, L = 5.00 days Target cycle service level, CSL = 0.95 Correlation Coefficient = All parts Correlation Cofficiant Demand data by part and region $205, 162 0.00 0.25 0.50 0.75 1.00 # of parts Region 1 Region 2 Region 3 Region 4 Region 5 All Regions Central CV 0.9 $144,599 $74,213 $19, 155 -$27,633 -$69,035 Part 1 Mean 10 35.48 22.61 17.66 11.81 3.36 90.92 90.91 0.91 $154,468 $80,830 $23,229 -$25,720 -$69,035 Part 1 SD 6.98 6.48 5.26 3.48 4.49 NA 12.27 0.135012 0.92 $165, 190 $88,019 $27,655 -$23,642 -$69,035 Part 3 Mean 20 2.48 4.15 3.15 6 .16 7.49 26.43 26.43 0.93 $176,979 $95,924 $32,521 -$21,357 -$69,035 Part 3 SD 3.16 6.20 6.39 6.76 3.56 NAI 12.15 0.459715 0.94 Target Cycle Service Level $190, 145 $104,752 $37,956 -$18,806 -$69,035 Part 7 Mean 70 0.48 0.73 0.80 1.94 2.54 6.491 6.49 0.95 $205, 162 $114,821 $44, 155 -$15,896 -$69,035 Part 7 SD 1.98 1.42 2.39 3.76 3.98 NA 6.45 0.994128 0.96 $222,804 $126,651 $51,438 -$12,477 -$69,035 0.97 $244,493 $141, 194 $60,391 -$8,273 -$69,035 Demand during reorder interval and replenishment lead time 0.98 $273,324 $160,526 $72,293 -$2,686 -$69,035 Region 1 Region 2 Region 3 Region 4 Region 5 All Regions Central 0.99 $318,766 $190,996 $91,052 $6, 121 -$69,035 Part 1 Mean 390.28 248.71 194.26 129.91 36.96 1000.12 000.01 Part 1 SD 23.15 21.49 17.45 11.54 4.89 NA 40.7 Part 3 Mean 27.28 45.65 67.65 67.76 32.39 290.73 290.73 Part 3 SD 10.48 20.56 21.19 22.42 11.81 NAI 40.30 Part 7 Mean 5.28 8.03 8.80 21.34 27.94 71.39 71.39 Part 7 SD 6.57 4.71 7.93 12.47 13.20 NA 21.40 Outputs Cycle stock and required safety stock by part and region Region 1 Region 2 Region 3 Region 4 Region 5 All Regions Central Inv Days Inv Days Centi Saving Part 1Cycle Inventory 106.44 67.8 52.98 35.43 10.08 272.76 272.73 3 3 Part 1 SS 38.08 35.35 18.98 24.49 145.60 66.96 1.073236 0.736537603 0.3367 Part 3 Cycle Inventory 7.44 12.45 18.45 18.48 22.47 79.29 79.29 3 Part 3 SS 17.24' 33.82 34.86 36.88 19.42 142.22 66.28 5.381055 0.736662883 4.64439 Part 7 Cycle Inventory 1.44 2.19 2.40 5.82 7.62 19.47 19.47 3 Part 7 SS 10.80 7.75 13.04 20.51 21.71 73.81 35.20 11.37304 5.423328828 5.94971 Costs per unit by region and part Region 1 Region 2 Region 3 Region 4 Region 5 All Regions Central Inventory cost 0.61 0.68 0.69 $ 0.69 1.54 $ 0.69 0.56 Transportation cost 0.19 AtAt 0.19 0.19 0.19 0. 19 $ 0.19 0.29 Total cost part 1 0.80 $ 0.87 0.88 0.88 1.73 0.88 0.85 Inventory cost 1.49 $ 1.67 1.30 $ 1.35 0.84 1.26 0.83 Transportation cost 0. 19 $ 0. 19 $ 0.19 $ 0.19 0.19 0.19 0.29 Total cost part 3 1.68 $ 1.86 $ 1.49 $ 1.54 9 1.03 1.45 1.12 Inventory cost 3.83 $ 2.04 $ 2.89 2.04 $ 1.73 2. 16 1.26 Transportation cost 0.19 $ 0.19 0.19 0. 19 0. 19 $ 0.19 0.29 Total cost part 7 4.02 $ 2.23 3.08 $ 2.23 $ 1.92 2.35 1.55 Total Annual Inventory and Distribution Cost # of part Region 1 Region 2 Region 3 Region 4 Region 5 All Regions Central Savings Part 1 10 $103,729 $72, 17 $56,964 $37,982 $21,260 $292, 107 $282,208 $9,899 Part 20 $30,463 $56,425 $66,904 $69, 161 $56,259 $279,213 $215,356 $63,857 Part 7 70 $49,246 $41,626 $63,051 $1 10,336 $124,747 $389,005 $257,600 $131,405 All Parts $183,439 $170,223 $186,920 $217,479 $202,266 $960,326 $755,164 Savings: $205, 162
Step by Step Solution
There are 3 Steps involved in it
Step: 1
Get Instant Access to Expert-Tailored Solutions
See step-by-step solutions with expert insights and AI powered tools for academic success
Step: 2
Step: 3
Ace Your Homework with AI
Get the answers you need in no time with our AI-driven, step-by-step assistance