Answered step by step
Verified Expert Solution
Question
1 Approved Answer
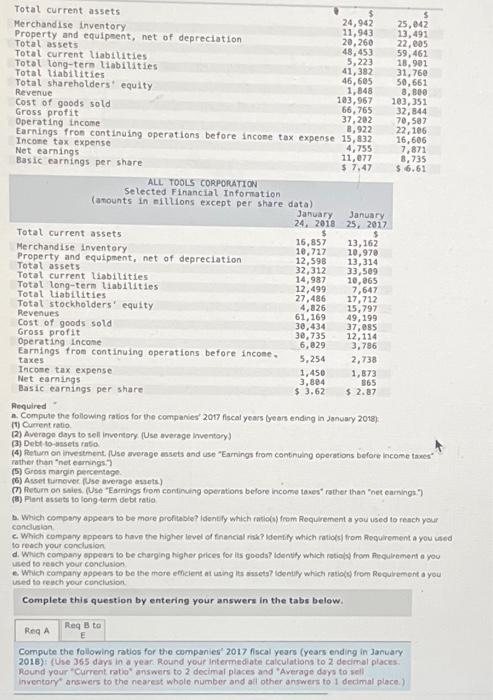
Total current assets $ $ Merchandise inventory 24,942 25,042 11,943 Property and equipment, net of depreciation 13,491 20,260 22,005 Total assets 48,453 59,461 Total

Total current assets $ $ Merchandise inventory 24,942 25,042 11,943 Property and equipment, net of depreciation 13,491 20,260 22,005 Total assets 48,453 59,461 Total current liabilities 5,223 18,901 Total long-term liabilities Total liabilities 41,382 31,760 46,605 50,661 Total shareholders' equity 1,848 8,800 Revenue 103,967 103,351 Cost of goods sold 66,765 32,844 Gross profit 37,202 Operating income 70,587 8,922 22,106 Earnings from continuing operations before income tax expense 15,832 16,606 Income tax expense 4,755 7,871 Net earnings 11,077 8,735 Basic earnings per share. $ 7,47 $6.61 ALL TOOLS CORPORATION Selected Financial Information (amounts in millions except per share data) January 24, 2018 January 25, 2017 Total current assets. $ $ 16,857 13,162 Merchandise inventory 10,717 10,970 Property and equipment, net of depreciation 12,598 13,314 Total assets 32,312 33,509 Total current liabilities 14,987 10,065 Total long-term liabilities 12,499 7,647 Total liabilities 27,486 17,712 Total stockholders' equity 4,826 15,797 Revenues 61,169 49,199 Cost of goods sold 30,434 37,085 Gross profit 30,735 12,114 Operating Income 6,829 3,786 Earnings from continuing operations before income. 5,254 2,738 taxes Income tax expense 1,450 1,873 Net earnings 3,804 865 Basic earnings per share $ 3.62 $ 2.87 Required a. Compute the following ratios for the companies' 2017 fiscal years (years ending in January 2018) (1) Current ratio (2) Average days to sell inventory (Use average Inventory) (3) Debt-to-assets ratio (4) Return on investment. (Use average assets and use "Earnings from continuing operations before income taxes rather than "net earnings.") (5) Gross margin percentage. (6) Asset turnover (Use average assets) Return on sales. (Use "Earnings from continuing operations before income taxes" rather than "net earnings.") (8) Plant assets to long-term debt ratio b. Which company appears to be more profitable? identify which ratio(s) from Requirement a you used to reach your conclusion c. Which company appears to have the higher level of financial risk? Identify which ratio(s) from Requirement a you used to reach your conclusion d. Which company appears to be charging higher prices for its goods? identify which ratios) from Requirement a you used to reach your conclusion Which company appears to be the more efficient at using its assets? identify which ratios) from Requirement a you used to reach your conclusion Complete this question by entering your answers in the tabs below. Req A Req B to Compute the following ratios for the companies 2017 fiscal years (years ending in January 2018): (Use 365 days in a year. Round your Intermediate calculations to 2 decimal places. Round your "Current ratio answers to 2 decimal places and "Average days to sell inventory answers to the nearest whole number and all other answers to 1 decimal place.)
Step by Step Solution
There are 3 Steps involved in it
Step: 1

Get Instant Access to Expert-Tailored Solutions
See step-by-step solutions with expert insights and AI powered tools for academic success
Step: 2

Step: 3

Ace Your Homework with AI
Get the answers you need in no time with our AI-driven, step-by-step assistance
Get Started


