

Answered step by step
Verified Expert Solution
Question
1 Approved Answer
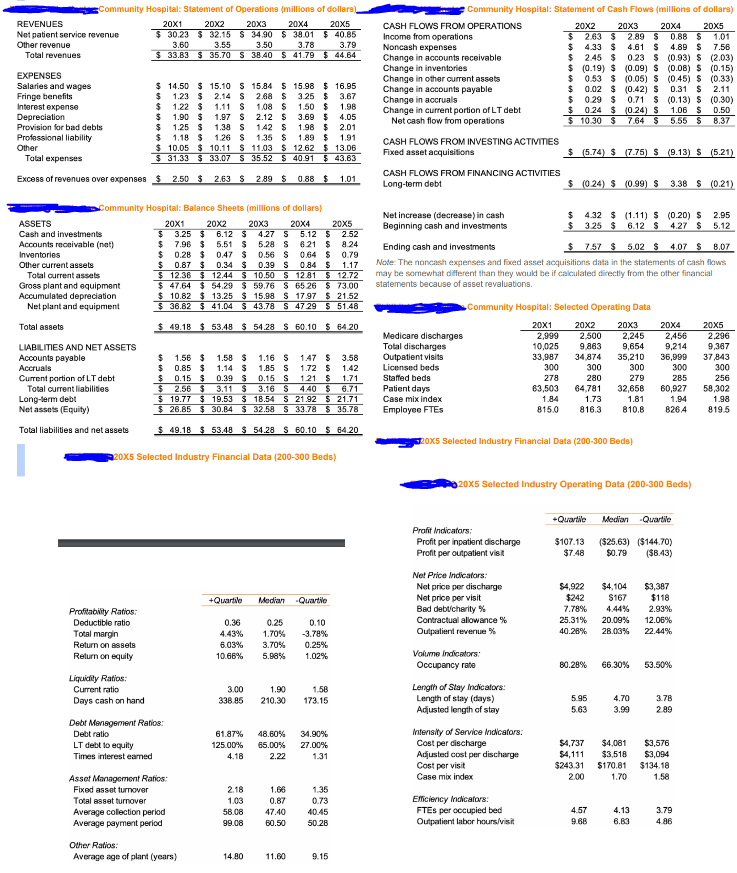
Total revenues EXPENSES Salaries and wages $ 14.50 $ Fringe benefits $ 1.23 $ 2.14 $ Interest expense $ 1.22 $ 1.11 S Depreciation
 <.00 .09 u.oo i.u1 communitv hosital: balance sheets imillions of dollars noke: i he noncasen exprenses and foced asset acquisitions data in the statements casn nows may be somewhat different than they would if calculated directly from other financial because revaluations. c_community hospital: selected operating industry beds fi>
 Total revenues EXPENSES Salaries and wages $ 14.50 $ Fringe benefits $ 1.23 $ 2.14 $ Interest expense $ 1.22 $ 1.11 S Depreciation $ 1.90 $ 1.97 S Provision for bad debts $ 1.25 $ Professional liability $ Other Total expenses 1.38 S 1.18 $ 1.26 S $ 10.05 $ 10.11 $ $ 31.33 $33.07 $ 15.10 $ 15.84 $ 15.98 $ 16.95 2.68 $ 3.25 $ 3.67 1.08 $ 1.50 $ 1.98 2.12 $ 1.42 $ 1.98 $ 2.01 1.35 $ 1.89 $ 1.91 11.03 $ 12.62 $ 13.06 35.52 $ 40.91 $ 43.63 REVENUES Community Hospital: Statement of Operations (millions of dollars) Net patient service revenue Other revenue 20X1 20X2 20X3 20X4 20X5 $ 30.23 $ 32.15 $ 34.90 $ 38.01 $ 40.85 3.60 3.50 3.78 $ 33.83 $ 35.70 $ 38.40 $ 41.79 $ 44.64 3.55 3.79 Community Hospital: Statement of Cash Flows (millions of dollars) CASH FLOWS FROM OPERATIONS Income from operations Noncash expenses Change in accounts receivable Change in inventories Change in other current assets Change in accounts payable Change in accruals 20X4 20X5 0.88 $ 1.01 $ 20x2 2.63 $ 20X3 2.89 $ $ 4.33 $ 4.61 $ 4.89 $ 7.56 $ 2.45 $ 0.23 $ (0.93) $ (2.03) $ (0.19) $ (0.09) $ (0.08) $ (0.15) $ 0.53 $ (0.05) $ (0.45) $ (0.33) $ 0.02 $ $ 3.69 $ 4.05 Change in current portion of LT debt Net cash flow from operations $ (0.42) $ 0.29 $ 0.71 0.24 $ (0.24) S $ 10.30 $ 7.64 $ 0.31 $ 2.11 (0.13) $ (0.30) 1.06 $ 0.50 5.55 $ 8.37 Excess of revenues over expenses $ 2.50 $ 2.63 $ 2.89 $ 0.88 $ 1.01 ASSETS Community Hospital: Balance Sheets (millions of dollars) 20X1 Cash and investments $ Accounts receivable (net) $ Inventories 3.25 $ 7.96 $ $ 0.28 $ $ 0.87 $ Other current assets Total current assets Gross plant and equipment Accumulated depreciation Net plant and equipment Total assets LIABILITIES AND NET ASSETS Accounts payable 20X3 20x2 20X4 20X5 6.12 $ 4.27 S 5.12 $ 2.52 5.51 $ 5.28 S 6.21 $ 8.24 0.47 $ 0.56 $ 0.64 $ 0.79 0.34 $ 0.39 S 0.84 $ 1.17 $ 12.38 $ 12.44 $10.50 $ 12.81 $ 12.72 $ 47.64 $ 54.29 $ 59.76 $ 65.26 $ 73.00 $10.82 $ 13.25 $ 15.98 $ 17.97 $ 21.52 $ 36.82 $ 41.04 $ 43.78 $ 47.29 $ 51.48 $ 49.18 $ 53.48 $ 54.28 $ 60.10 $ 64.20 CASH FLOWS FROM INVESTING ACTIVITIES Fixed asset acquisitions CASH FLOWS FROM FINANCING ACTIVITIES Long-term debt Net increase (decrease) in cash Beginning cash and investments Ending cash and investments $ (5.74) $ (7.75) $ (9.13) $ (5.21) $ (0.24) $ (0.99) $ 3.38 $ (0.21) $ $ 4.32 $ (1.11) S (0.20) $ 3.25 $ 6.12 $ 4.27 $ 5.12 2.95 $ 7.57 $ 5.02 $ 4.07 $ 8.07 Note: The noncash expenses and fixed asset acquisitions data in the statements of cash flows may be somewhat different than they would be if calculated directly from the other financial statements because of asset revaluations. Community Hospital: Selected Operating Data 20X1 20X2 20X3 20X4 20X5 Medicare discharges 2,999 2,500 2,245 2,456 2,296 Total discharges 10,025 9,863 9,654 9,214 9,367 $ Accruals Current portion of LT debt $ 1.56 $ $ 0.85 $ 0.15 $ 1.58 $ 1.16 $ 1.14 $ 1.85 S 0.39 $ 0.15 S 1.47 $ 1.72 $ 121 $ 3.58 Outpatient visits 33,987 34,874 35,210 36,999 37,843 1.42 1.71 Licensed beds 300 300 300 300 300 Staffed beds 278 280 279 285 256 Total current liabilities $ 2.56 $ 3.11 $ Long-term debt $ 19.77 $ 19.53 $ 18.54 $ Net assets (Equity) Total liabilities and net assets $ 26.85 $ 30.84 $32.58 $ 21.92 $ 21.71 33.78 $ 35.78 $ 49.18 $ 53.48 $ 54.28 $ 60.10 $ 64.20 20x5 Selected Industry Financial Data (200-300 Beds) Patient days Case mix index 3.16 $ 4.40 $ 6.71 63,503 64,781 32,658 60,927 58,302 1.84 1.73 1.81 1.94 1.98 Employee FTEs 815.0 816.3 810.8 826.4 819.5 20x5 Selected Industry Financial Data (200-300 Beds) 20x5 Selected Industry Operating Data (200-300 Beds) +Quartile Median Quartile Profit Indicators: Profit per inpatient discharge Profit per outpatient visit $107.13 ($25.63) ($144.70) $7.48 $0.79 ($8.43) Net Price Indicators: +Quartile Median -Quartile Profitability Ratios: Deductible ratio Total margin Return on assets Return on equity Liquidity Ratios: Current ratio Days cash on hand Debt Management Ratios: Debt ratio 3.00 338.85 1.90 210.30 1.58 173.15 61.87% 48.60% 34.90% 125.00% 0.36 0.25 0.10 4.43% 1.70% -3.78% 6.03% 3.70% 0.25% 10.66% 5.98% 1.02% Adjusted length of stay 5.95 5.63 4.70 3.78 3.99 2.89 Intensity of Service Indicators: LT debt to equity 65.00% 27.00% Cost per discharge $4,737 $4,081 $3,576 Times interest eamed 4.18 2.22 1.31 Adjusted cost per discharge $4,111 $3,518 $3,094 Cost per visit $243.31 $170.81 $134.18 Asset Management Ratios: Case mix index 2.00 1.70 1.58 Fixed asset turnover 2.18 1.66 1.35 Total asset turnover 1.03 0.87 0.73 Efficiency Indicators: Average collection period 58.08 47.40 40.45 FTEs per occupied bed 4.57 4.13 3.79 Average payment period 99.08 60.50 50.28 Outpatient labor hours/visit 9.68 6.83 4.86 Other Ratios: Average age of plant (years) 14.80 11.60 9.15 Net price per discharge Net price per visit Bad debt/charity% Contractual allowance % Outpatient revenue % Volume Indicators: Occupancy rate Length of Stay Indicators: Length of stay (days) $4,922 $4,104 $3,387 $242 40.26% 7.78% 25.31% 20.09% 28.03% $167 4.44% $118 2.93% 12.06% 22.44% 80.28% 66.30% 53.50%
Step by Step Solution
There are 3 Steps involved in it
Step: 1

Get Instant Access to Expert-Tailored Solutions
See step-by-step solutions with expert insights and AI powered tools for academic success
Step: 2

Step: 3
Ace Your Homework with AI
Get the answers you need in no time with our AI-driven, step-by-step assistance
Get Started
Inventory Best Practices
Authors: Steven M. Bragg
2nd Edition
1118000749, 9781118000748