Answered step by step
Verified Expert Solution
Question
1 Approved Answer
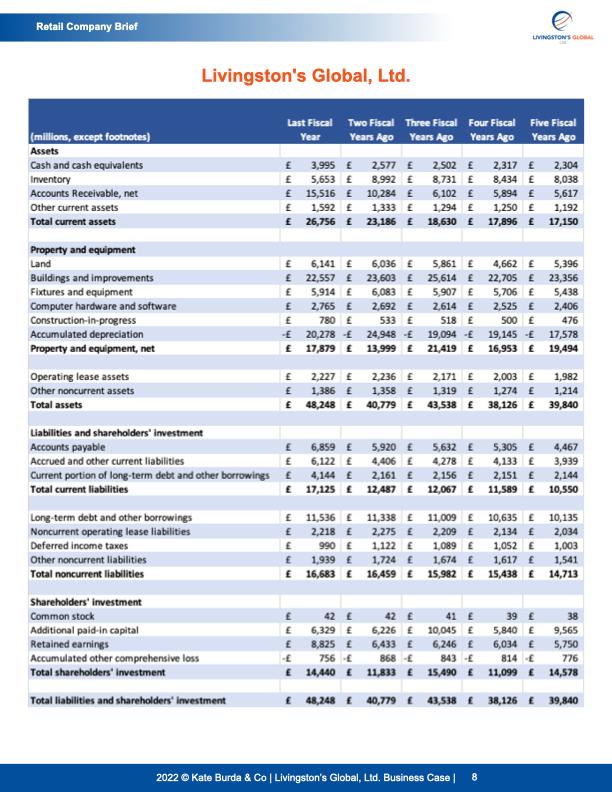
- Total shareholder equity has gone up by 22%. a. Which part of shareholder equity went up the most? b. What does that mean? c.


- Total shareholder equity has gone up by 22%.
a. Which part of shareholder equity went up the most?
b. What does that mean?
c. Would that be a concern if you were investor?
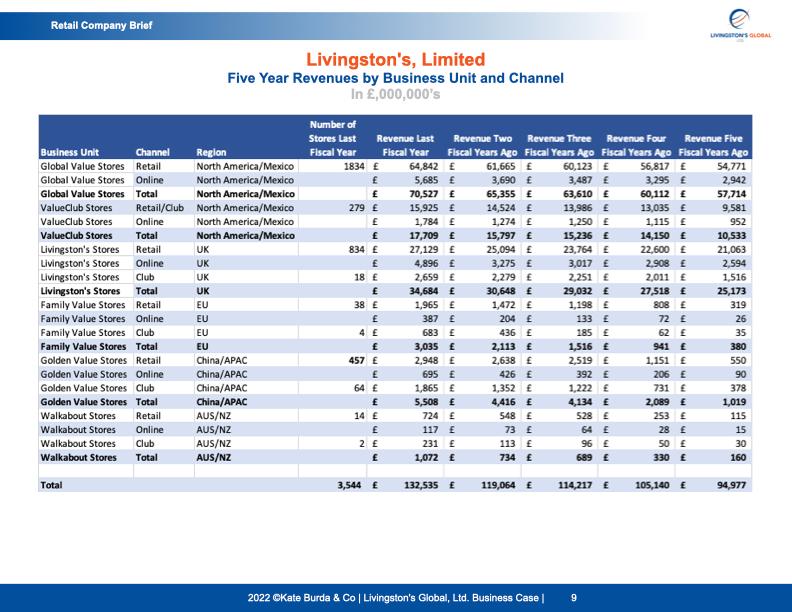
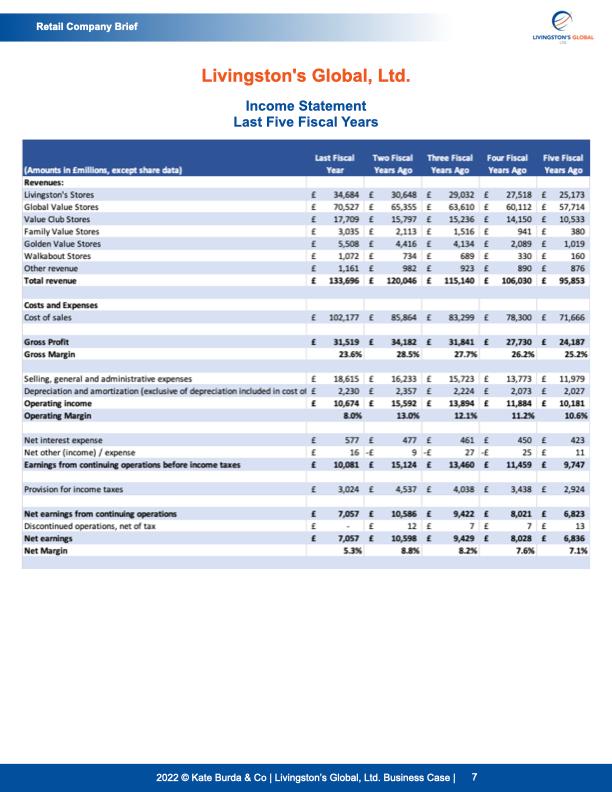
Retail Company Brief LIVINGSTONS GLOBAL Livingston's, Limited Five Year Revenues by Business Unit and Channel In 2,000,000's UK Business Unit Channel Region Global Value Stores Retail North America/Mexico Global Value Stores Online North America/Mexico Global Value Stores Total North America/Mexico ValueClub Stores Retail/Club North America/Mexico ValueClub Stores Online North America/Mexico ValueClub Stores Total North America/Mexico Livingston's Stores Retail UK Livingston's Stores Online UK Livingston's Stores Club UK Livingston's Stores Total Family Value Stores Retail EU Family Value Stores Online Family Value Stores Club EU Family Value Stores Total EU Golden Value Stores Retail China/APAC Golden Value Stores Online China/APAC Golden Value Stores Club China/APAC Golden Value Stores Total China/APAC Walkabout Stores Retail AUS/NZ Walkabout Stores Online AUS/NZ Walkabout Stores Club AUS/NZ Walkabout Stores Total AUS/NZ Number of Stores Last Revenue Last Revenue Two Revenue Three Revenue Four Revenue Five Fiscal Year Fiscal Year Fiscal Years Ago Fiscal Years Ago Fiscal Years Ago Fiscal Years Ago 1834 E 64,842 E 61,665 E 60,123 E 56,817 54,771 5,685 3,690 3,487 E 3,295 E 2,942 70,527 65,355 63,610 60,112 57,714 279 15,925 14,524 E 13,986 E 13,035 9,581 E 1,784 E 1,274 1,250 1.115 E 952 E 17,709 E 15,797 E 15,236 14,150 E 10,533 834 E 27,129 E 25,094 23,764 22,600 E 21,063 E 4,896 3,275 E 3,017 E 2.908 E 2,594 18 E 2,659 2,279 2,251 2,011 E 1,516 34,684 E 30,648 29,032 27,518 25,173 38 E 1,965 1,472 1,198 E 808 319 E 387 E 204 133 E 72 E 26 4 E 683 E 436 185 E 62 E 35 3,035 2,113 1,516 941 380 457 E 2,948 E 2,638 E 2,519 1,151 E 550 E 695 426 392 206 E 90 64 1,865 1,352 1,222 731 378 5,508 E 4,416 4,134 E 2,089 1,019 14 E 724 E 548 528 253 E 115 E 117 E 73 64 28 E 15 2 E 231 113 E 96 E 50 30 E 1,072 E 734 689 330 E 160 EU Total 3,544 E 132,535 119,064 114,217 E 105,140 94,977 2022 Kate Burda & Co | Livingston's Global, Ltd. Business Case 9 Retail Company Brief LIVINGSTONG Livingston's Global, Ltd. Income Statement Last Five Fiscal Years (Amounts in Emilions, except share data) Last Fiscal Year Two Fiscal Three Fiscal Four Fiscal Years Ago Years Ago Years Ago Five Fiscal Years Ago Revenues: Livingston's Stores Global Value Stores Value Club Stores Family Value Stores Golden Value Stores Walkabout Stores Other revenue Total revenue E E E E 34,684 70,527 E 17,709 E 3,035 5,508 E 1,072 1,161 133,696 E 30,648 E 29,032 27,518 E 25,173 65,355 E 63,610 60,112 E 57,714 15,797 15,236 14,150 10,533 2,113 1.516 E 380 4416 4.134 E 2,089 E 1,019 734 689 E330 E 160 982 E 923 E 890 876 120,046 115,140 106,030 E 95,853 Costs and Expenses Cost of sales E 102,177 85 864 E 83,299 78,300 71,666 31,519 23.6% 34,182 28.5% 31,841 27.7% 27,730 E 24,187 26.2% 25.2% Gross Profit Gross Margin Selline, general and administrative expenses E Depreciation and amortization (exclusive of depreciation included in cost of Operating Income E Operating Margin 18,615 E 16,233 E 15,723 E 2.230 2,357 E 2.224 10,674 E 15,592 13,894 E 8.0% 13.0% 12.15 13,773 E 11,979 2,073 E 2,027 11,884 E 10,181 11.25 10.6% Net interest expense Net other income) / expense Earnings from continuing operations before income taxes E 577 16 10,081 477 9 15,124 E 461 E 27 13.460 E 450 25 11,459 423 11 9,747 Provision for income taxes E 3,024 4,537 4,038 E 3,438 E 2,924 Net earnings from continuing operations Discontinued operations, net of tax Net earnings Net Margin E E E 7,057 E E 7,057 E 5.3% 10,585 12 10,598 8.8% 9,422 TE 9,429 8.2 8,021 7 E 8,028 E 7.6N 6,823 13 6,836 7.1% 2022 Kate Burda & Co | Livingston's Global, Ltd. Business Case | 7 Retail Company Brief LIVINGSTON'S GLO Livingston's Global, Ltd. (millions, except footnotes) Assets Cash and cash equivalents Inventory Accounts Receivable, net Other current assets Total current assets Last Fiscal Two Fiscal Three Fiscal Four Fiscal Five Fiscal Year Years Ago Years Ago Years Ago Years Ago 3,995 E 2.577 E 2.502 E 2,317 2,304 E 5,653 8,992 E 8,731 E 8,434 E 8,038 E 15,516 10,284 E 6,102 E 5,894 E 5,617 E 1,592 E 1,333 E 1.294 E 1,250 1,192 E 26,756 23,186 E 18,630 E 17,896 17,150 E we E Property and equipment Land 6,141 6,036 E 5,861 4,662 5,396 Buildings and improvements 22,557 23,603 25,614 22,705 23,356 Fixtures and equipment 5,914 6,083 E 5,907 5,706 5,438 Computer hardware and software E 2,765 E 2,692 E 2,614 2,525 2,406 Construction-in-progress 780 E 533 E 518 E 500 E 476 Accumulated depreciation 20,278 24,948 19,094 19,145 E 17,578 Property and equipment, net 17,879 13,999 21,419 16,953 19,494 Operating lease assets 2,227 2,236 E 2,171 E 2,003 E 1,982 Other noncurrent assets E 1,386 E 1,358 E 1.319 1,274 1,214 Total assets 48,248 40,779 43,538 E38,126 39,840 Liabilities and shareholders' Investment Accounts payable 6,859 5,920 E 5,632 E 5,305 E 4,467 Accrued and other current liabilities 6,122 4,406 E 4,278 E 4,133 E 3,939 Current portion of long-term debt and other borrowings 4,144 2,161 2,156 E 2,151 E 2,144 Total current liabilities 17,125 12,487 E 12,067 11,589 10.550 E E Long-term debt and other borrowings Noncurrent operating lease liabilities Deferred income taxes Other noncurrent liabilities Total noncurrent liabilities E 11,536 E 11,338 E 11,009 E 10,635 E 10,135 E 2,218 2,275 2,209 2,134 2,034 990 1,122 1,089 E 1,052 1,003 1,939 1,724 1,674 1,617 1,541 E 16,683 16,459 15,982 15,438 14,713 Shareholders' investment Common stock Additional paid in capital Retained earnings Accumulated other comprehensive loss Total shareholders' Investment Total liabilities and shareholders' investment E E E - E 42 42 41 E 39 38 6,329 6,226 10,045 5,840 E 9,565 8,825 6,433 6,246 6,034 5,750 756 868 843 E 814 - 776 14,440 11,833 15,490 11,099 14,578 48,248 40,779 43,538 38,126 39,840 2022 Kate Burda & Co | Livingston's Global, Ltd. Business Case | 8 Retail Company Brief LIVINGSTONS GLOBAL Livingston's, Limited Five Year Revenues by Business Unit and Channel In 2,000,000's UK Business Unit Channel Region Global Value Stores Retail North America/Mexico Global Value Stores Online North America/Mexico Global Value Stores Total North America/Mexico ValueClub Stores Retail/Club North America/Mexico ValueClub Stores Online North America/Mexico ValueClub Stores Total North America/Mexico Livingston's Stores Retail UK Livingston's Stores Online UK Livingston's Stores Club UK Livingston's Stores Total Family Value Stores Retail EU Family Value Stores Online Family Value Stores Club EU Family Value Stores Total EU Golden Value Stores Retail China/APAC Golden Value Stores Online China/APAC Golden Value Stores Club China/APAC Golden Value Stores Total China/APAC Walkabout Stores Retail AUS/NZ Walkabout Stores Online AUS/NZ Walkabout Stores Club AUS/NZ Walkabout Stores Total AUS/NZ Number of Stores Last Revenue Last Revenue Two Revenue Three Revenue Four Revenue Five Fiscal Year Fiscal Year Fiscal Years Ago Fiscal Years Ago Fiscal Years Ago Fiscal Years Ago 1834 E 64,842 E 61,665 E 60,123 E 56,817 54,771 5,685 3,690 3,487 E 3,295 E 2,942 70,527 65,355 63,610 60,112 57,714 279 15,925 14,524 E 13,986 E 13,035 9,581 E 1,784 E 1,274 1,250 1.115 E 952 E 17,709 E 15,797 E 15,236 14,150 E 10,533 834 E 27,129 E 25,094 23,764 22,600 E 21,063 E 4,896 3,275 E 3,017 E 2.908 E 2,594 18 E 2,659 2,279 2,251 2,011 E 1,516 34,684 E 30,648 29,032 27,518 25,173 38 E 1,965 1,472 1,198 E 808 319 E 387 E 204 133 E 72 E 26 4 E 683 E 436 185 E 62 E 35 3,035 2,113 1,516 941 380 457 E 2,948 E 2,638 E 2,519 1,151 E 550 E 695 426 392 206 E 90 64 1,865 1,352 1,222 731 378 5,508 E 4,416 4,134 E 2,089 1,019 14 E 724 E 548 528 253 E 115 E 117 E 73 64 28 E 15 2 E 231 113 E 96 E 50 30 E 1,072 E 734 689 330 E 160 EU Total 3,544 E 132,535 119,064 114,217 E 105,140 94,977 2022 Kate Burda & Co | Livingston's Global, Ltd. Business Case 9 Retail Company Brief LIVINGSTONG Livingston's Global, Ltd. Income Statement Last Five Fiscal Years (Amounts in Emilions, except share data) Last Fiscal Year Two Fiscal Three Fiscal Four Fiscal Years Ago Years Ago Years Ago Five Fiscal Years Ago Revenues: Livingston's Stores Global Value Stores Value Club Stores Family Value Stores Golden Value Stores Walkabout Stores Other revenue Total revenue E E E E 34,684 70,527 E 17,709 E 3,035 5,508 E 1,072 1,161 133,696 E 30,648 E 29,032 27,518 E 25,173 65,355 E 63,610 60,112 E 57,714 15,797 15,236 14,150 10,533 2,113 1.516 E 380 4416 4.134 E 2,089 E 1,019 734 689 E330 E 160 982 E 923 E 890 876 120,046 115,140 106,030 E 95,853 Costs and Expenses Cost of sales E 102,177 85 864 E 83,299 78,300 71,666 31,519 23.6% 34,182 28.5% 31,841 27.7% 27,730 E 24,187 26.2% 25.2% Gross Profit Gross Margin Selline, general and administrative expenses E Depreciation and amortization (exclusive of depreciation included in cost of Operating Income E Operating Margin 18,615 E 16,233 E 15,723 E 2.230 2,357 E 2.224 10,674 E 15,592 13,894 E 8.0% 13.0% 12.15 13,773 E 11,979 2,073 E 2,027 11,884 E 10,181 11.25 10.6% Net interest expense Net other income) / expense Earnings from continuing operations before income taxes E 577 16 10,081 477 9 15,124 E 461 E 27 13.460 E 450 25 11,459 423 11 9,747 Provision for income taxes E 3,024 4,537 4,038 E 3,438 E 2,924 Net earnings from continuing operations Discontinued operations, net of tax Net earnings Net Margin E E E 7,057 E E 7,057 E 5.3% 10,585 12 10,598 8.8% 9,422 TE 9,429 8.2 8,021 7 E 8,028 E 7.6N 6,823 13 6,836 7.1% 2022 Kate Burda & Co | Livingston's Global, Ltd. Business Case | 7 Retail Company Brief LIVINGSTON'S GLO Livingston's Global, Ltd. (millions, except footnotes) Assets Cash and cash equivalents Inventory Accounts Receivable, net Other current assets Total current assets Last Fiscal Two Fiscal Three Fiscal Four Fiscal Five Fiscal Year Years Ago Years Ago Years Ago Years Ago 3,995 E 2.577 E 2.502 E 2,317 2,304 E 5,653 8,992 E 8,731 E 8,434 E 8,038 E 15,516 10,284 E 6,102 E 5,894 E 5,617 E 1,592 E 1,333 E 1.294 E 1,250 1,192 E 26,756 23,186 E 18,630 E 17,896 17,150 E we E Property and equipment Land 6,141 6,036 E 5,861 4,662 5,396 Buildings and improvements 22,557 23,603 25,614 22,705 23,356 Fixtures and equipment 5,914 6,083 E 5,907 5,706 5,438 Computer hardware and software E 2,765 E 2,692 E 2,614 2,525 2,406 Construction-in-progress 780 E 533 E 518 E 500 E 476 Accumulated depreciation 20,278 24,948 19,094 19,145 E 17,578 Property and equipment, net 17,879 13,999 21,419 16,953 19,494 Operating lease assets 2,227 2,236 E 2,171 E 2,003 E 1,982 Other noncurrent assets E 1,386 E 1,358 E 1.319 1,274 1,214 Total assets 48,248 40,779 43,538 E38,126 39,840 Liabilities and shareholders' Investment Accounts payable 6,859 5,920 E 5,632 E 5,305 E 4,467 Accrued and other current liabilities 6,122 4,406 E 4,278 E 4,133 E 3,939 Current portion of long-term debt and other borrowings 4,144 2,161 2,156 E 2,151 E 2,144 Total current liabilities 17,125 12,487 E 12,067 11,589 10.550 E E Long-term debt and other borrowings Noncurrent operating lease liabilities Deferred income taxes Other noncurrent liabilities Total noncurrent liabilities E 11,536 E 11,338 E 11,009 E 10,635 E 10,135 E 2,218 2,275 2,209 2,134 2,034 990 1,122 1,089 E 1,052 1,003 1,939 1,724 1,674 1,617 1,541 E 16,683 16,459 15,982 15,438 14,713 Shareholders' investment Common stock Additional paid in capital Retained earnings Accumulated other comprehensive loss Total shareholders' Investment Total liabilities and shareholders' investment E E E - E 42 42 41 E 39 38 6,329 6,226 10,045 5,840 E 9,565 8,825 6,433 6,246 6,034 5,750 756 868 843 E 814 - 776 14,440 11,833 15,490 11,099 14,578 48,248 40,779 43,538 38,126 39,840 2022 Kate Burda & Co | Livingston's Global, Ltd. Business Case | 8Step by Step Solution
There are 3 Steps involved in it
Step: 1

Get Instant Access to Expert-Tailored Solutions
See step-by-step solutions with expert insights and AI powered tools for academic success
Step: 2

Step: 3

Ace Your Homework with AI
Get the answers you need in no time with our AI-driven, step-by-step assistance
Get Started


