Question
Tourism has become one of the worlds major industries and has been playing an increasingly bigger role in economic growth during the past few decades.
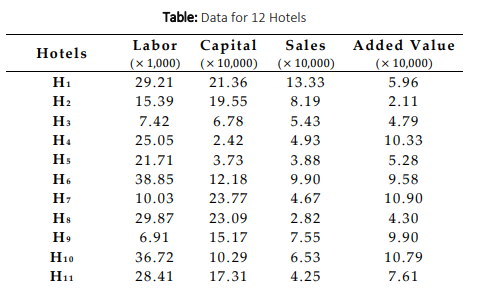
Tourism has become one of the worlds major industries and has been playing an increasingly bigger role in economic growth during the past few decades. According to the World Tourism Organization, international travel and tourism provide 300 million direct and indirect jobs and create about 13% of the worlds gross domestic product. Performance evaluation is always a major concern of top management in the tourism industry. Among the techniques of assessing tourism performance, data envelopment analysis (DEA) may be the most popular because it is able to handle multiple inputs and outputs and does not require an assumption about production function form. The following problem presents an application of DEA in the tourism sector for comparing the relative efficiency of 12 hotels, denoted by H 1 to H1 2 , in Portugal. We measured the hotel production based on two inputs and two outputs. The two outputs are sales and added value. The two inputs are labor, the number of full-time-equivalent employees, and capital, measured by the book value of the assets. The following table presents the data.


Formulate a linear programming model that can be used to evaluate the efficiency score of hotel H7
Assume we already solved the DEA model that you developed in part (a) and obtained its optimal solution. How many efficient hotel(s) can be determined from the optimal solution? How many inefficient hotel(s) can be determined? Justify your answer.
Suppose we add a new hotel H1 3 to the above analysis. Discuss the impact of this addition on the DEA model in part (a). Discuss the impact on the efficiency score of H7 .
Hotels H Table: Data for 12 Hotels Labor Capital Sales (x 1,000) (x 10,000) (x 10,000) 29.21 21.36 13.33 15.39 19.55 8.19 7.42 6.78 5.43 25.05 4.93 21.71 3.73 3.88 38.85 12.18 9.90 10.03 23.77 4.67 29.87 23.09 2.82 6.91 15.17 7.55 36.72 10.29 6.53 28.41 17.31 4.25 2.42 Added Value (x 10,000) 5.96 2.11 4.79 10.33 5.28 9.58 10.90 4.30 9.90 10.79 7.61 H10 Hu 22.45 16.39 3.53 6.89 Hotels H Table: Data for 12 Hotels Labor Capital Sales (x 1,000) (x 10,000) (x 10,000) 29.21 21.36 13.33 15.39 19.55 8.19 7.42 6.78 5.43 25.05 4.93 21.71 3.73 3.88 38.85 12.18 9.90 10.03 23.77 4.67 29.87 23.09 2.82 6.91 15.17 7.55 36.72 10.29 6.53 28.41 17.31 4.25 2.42 Added Value (x 10,000) 5.96 2.11 4.79 10.33 5.28 9.58 10.90 4.30 9.90 10.79 7.61 H10 Hu 22.45 16.39 3.53 6.89
Step by Step Solution
There are 3 Steps involved in it
Step: 1

Get Instant Access to Expert-Tailored Solutions
See step-by-step solutions with expert insights and AI powered tools for academic success
Step: 2

Step: 3

Ace Your Homework with AI
Get the answers you need in no time with our AI-driven, step-by-step assistance
Get Started


