

Answered step by step
Verified Expert Solution
Question
1 Approved Answer
9 LOGIC COMPANY Comparative Income Statement For Years Ended December 31, 2017 and 2018 2 points 2018 2017 $23,800 $18,600 1,000 100 $22,800 $18,500 19,800
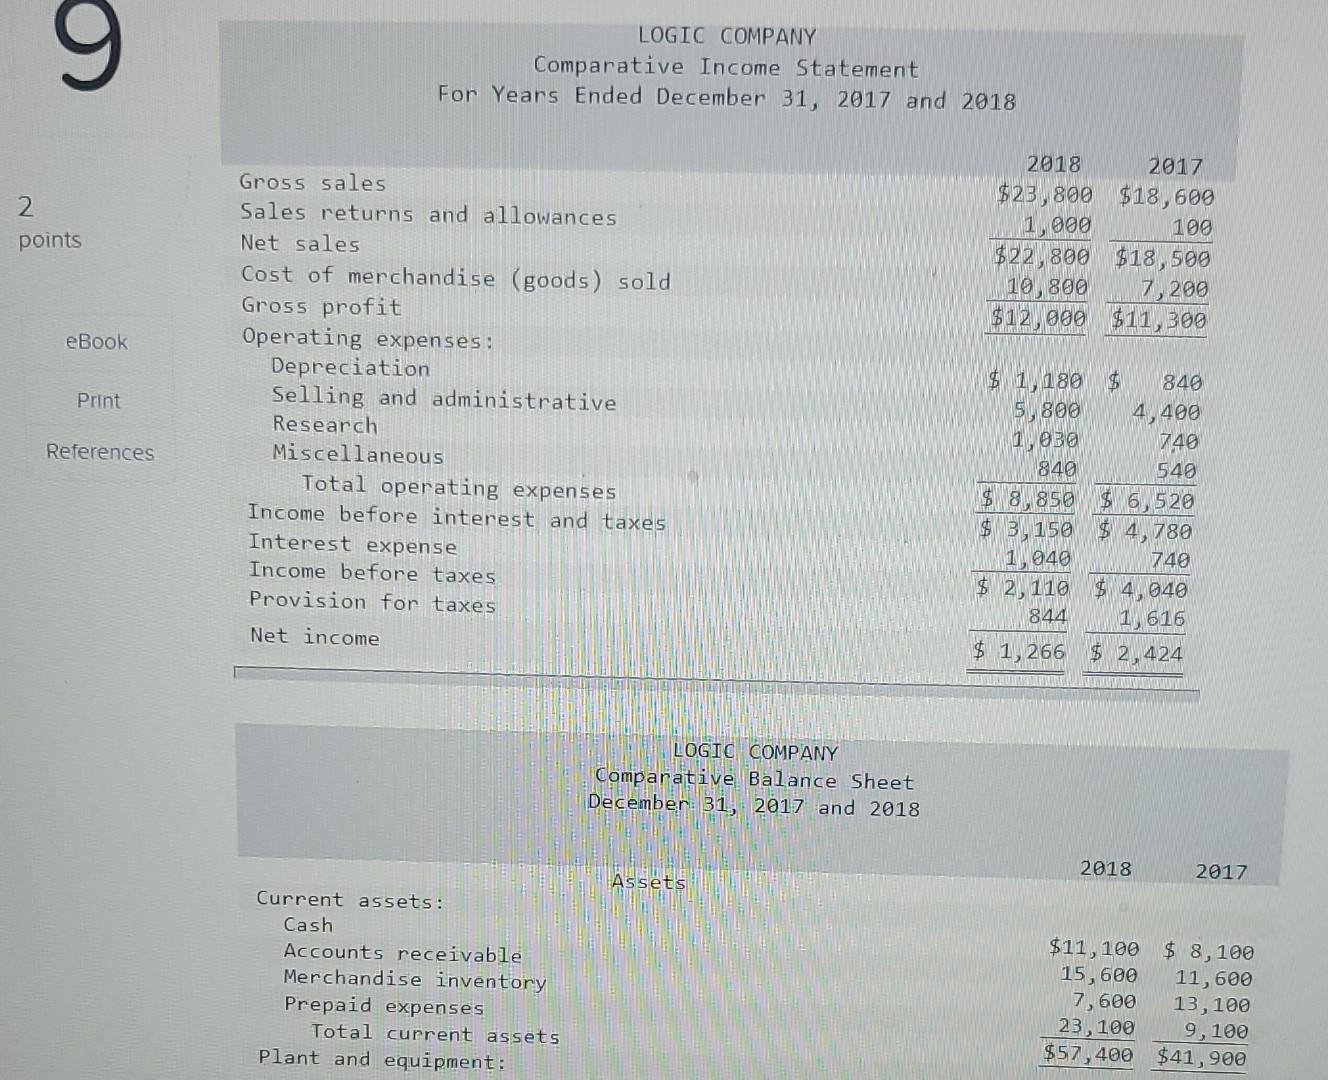


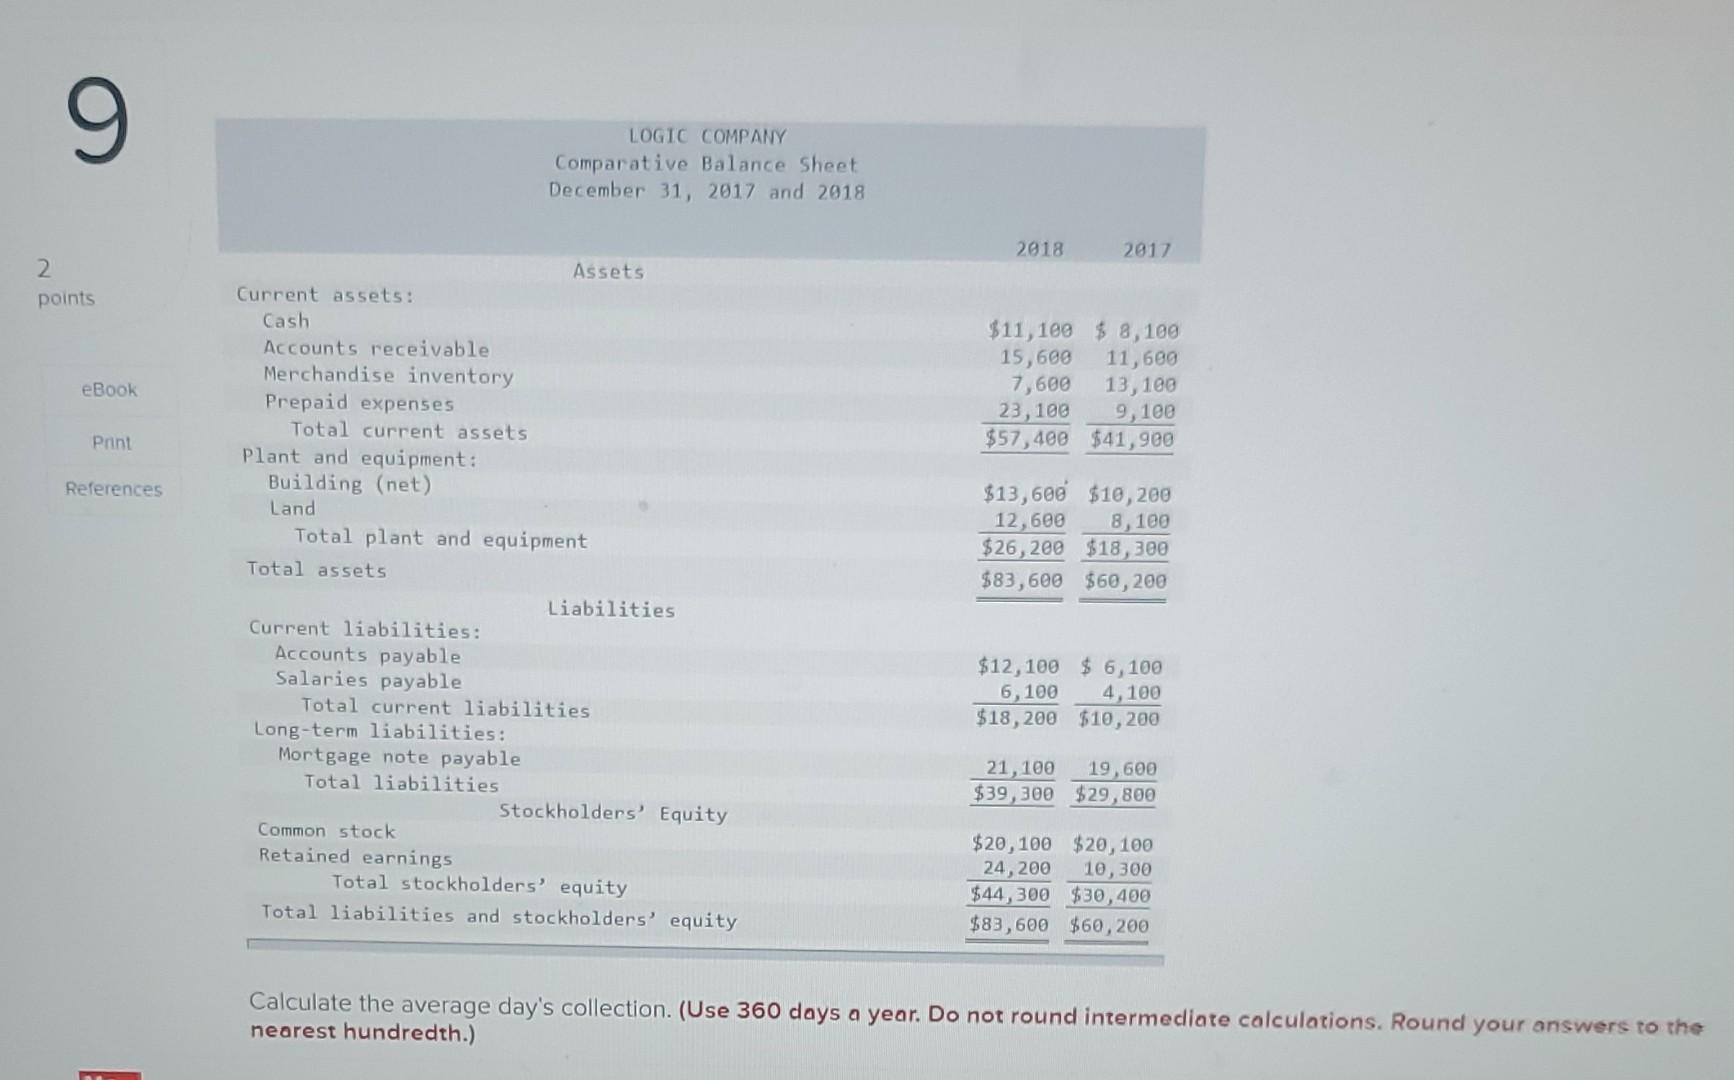
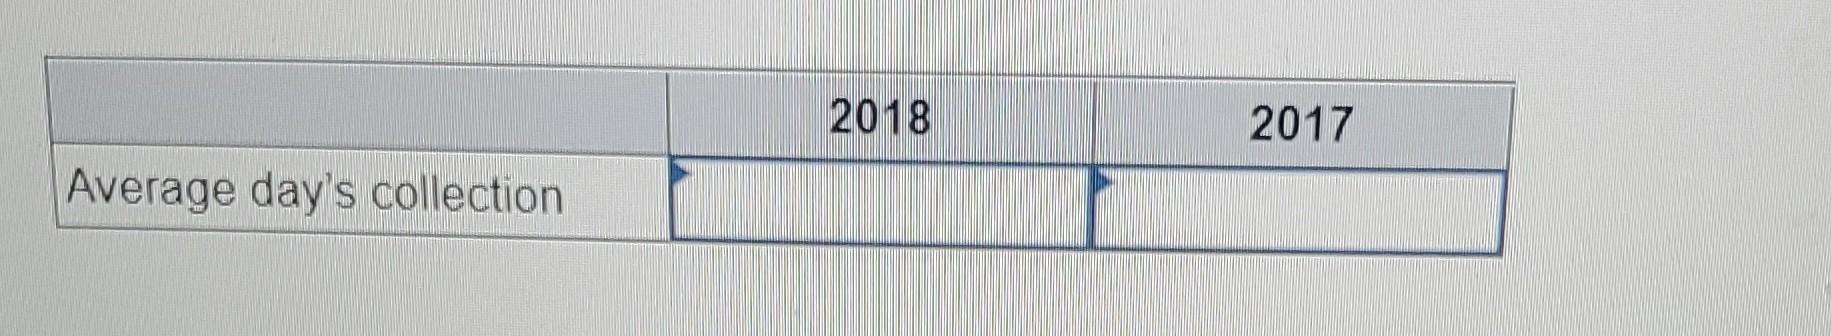
9 LOGIC COMPANY Comparative Income Statement For Years Ended December 31, 2017 and 2018 2 points 2018 2017 $23,800 $18,600 1,000 100 $22,800 $18,500 19,800 7,200 $12,000 $11,300 eBook Print Gross sales Sales returns and allowances Net sales Cost of merchandise (goods) sold Gross profit Operating expenses: Depreciation Selling and administrative Research Miscellaneous Total operating expenses Income before interest and taxes Interest expense Income before taxes Provision for taxes Net income References $ 1180 $ 840 5 800 4,400 1,030 740 840 540 $ 8 850 $ 6, 520 $ 3,150 $4,780 1040 740 $ 2, 110 $4, 040 844 1,616 $ 1, 266 $ 2, 424 LOGIC COMPANY Comparative Balance Sheet December 31, 2017 and 2018 2018 Assets 2017 Current assets: Cash Accounts receivable Merchandise inventory Prepaid expenses Total current assets Plant and equipment: $11,100 $ 8,100 15,600 11,600 7,600 13,100 23,100 9,100 $57,400 $41,900 9 LOGIC COMPANY Comparative Balance Sheet December 31, 2017 and 2018 2018 2017 2 points eBook $11,100 $ 8,109 15,600 11,609 7,600 13,100 23, 100 9,100 $57,400 $41,900 Print References Assets Current assets: Cash Accounts receivable Merchandise inventory Prepaid expenses Total current assets Plant and equipment: Building (net) Land Total plant and equipment Total assets Liabilities Current liabilities: Accounts payable Salaries payable Total current liabilities Long-term liabilities: Mortgage note payable Total liabilities Stockholders' Equity Common stock Retained earnings Total stockholders' equity Total liabilities and stockholders' equity $13,600 $10,200 12,600 8,100 $26,200 $18,300 $83,600 $60,200 $12,100 $ 6,100 6,100 4,100 $18,200 $10,200 21,100 19,600 $39,300 $29,800 $20,100 $20,100 24, 200 10,300 $44,300 $30,400 $83,600 $60,200 Calculate the average day's collection. (Use 360 days a year. Do not round intermediate calculations. Round your answers to the nearest hundredth.) 2018 2017 Average day's collection
Step by Step Solution
There are 3 Steps involved in it
Step: 1

Get Instant Access to Expert-Tailored Solutions
See step-by-step solutions with expert insights and AI powered tools for academic success
Step: 2

Step: 3
Ace Your Homework with AI
Get the answers you need in no time with our AI-driven, step-by-step assistance
Get Started
Survey Of Accounting
Authors: Carl S. Warren, Amanda Farmer
9th Edition
0357132599, 978-0357132593