

Answered step by step
Verified Expert Solution
Question
1 Approved Answer
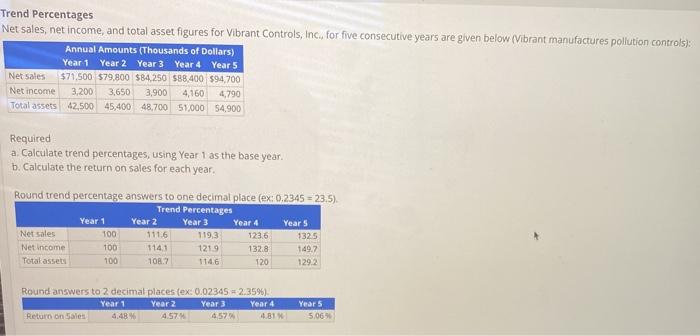
Trend Percentages Net sales, net income, and total asset figures for Vibrant Controls, Inc. for five consecutive years are given below (Vibrant manufactures pollution controls):
Step by Step Solution
There are 3 Steps involved in it
Step: 1

Get Instant Access to Expert-Tailored Solutions
See step-by-step solutions with expert insights and AI powered tools for academic success
Step: 2

Step: 3
Ace Your Homework with AI
Get the answers you need in no time with our AI-driven, step-by-step assistance
Get Started
Mastering SAP FICO A Comprehensive Guide To Financial Accounting And Controlling
Authors: Daniel Moussima
1st Edition
979-8859658541