
t-Test in one sample case, t-Test in two sample case, ANOVA, Correlation Analysis / Simple Linear Regression
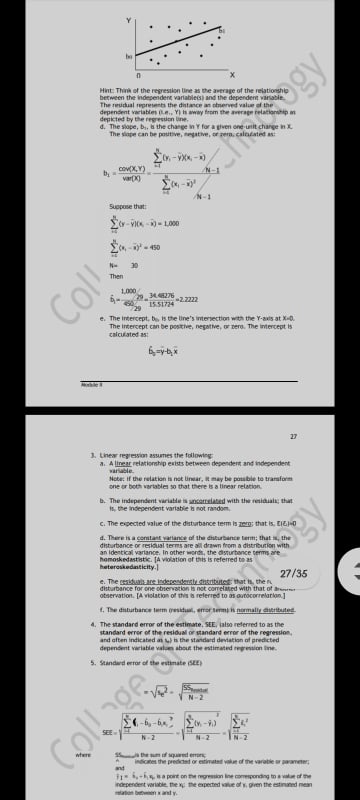
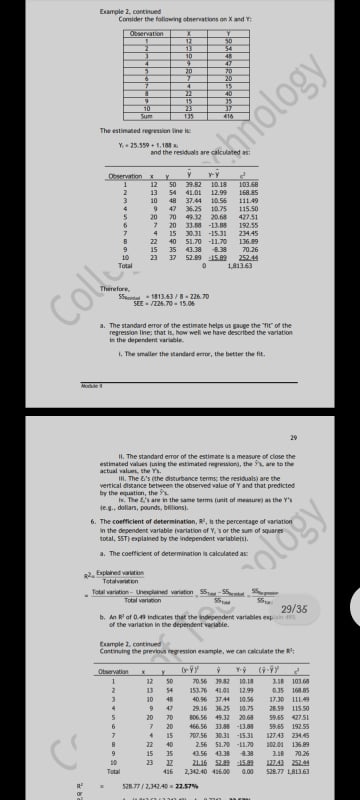
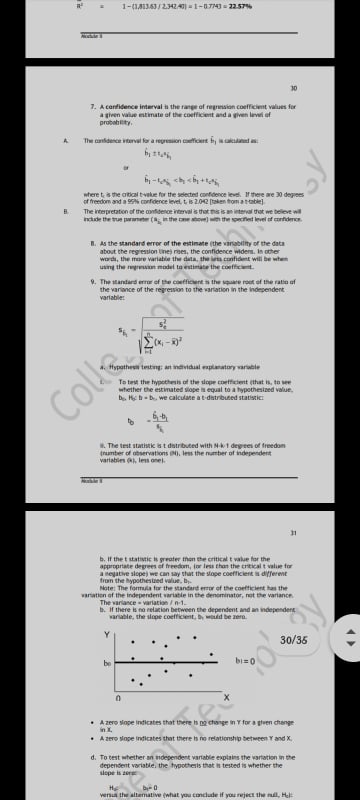
T-TEST IN ONE SAMPLE CASE The t test! ' T tests are for comparing two groups, t tests can be ined to look at more than two groups, but for each given totest, only two groups are considered. from the formula for the "calculmed tovalue". the numerator compares the two means, finding the magnitude of the difference between them iin some formulas, the absolute wake is tower, in you don't get a negative numberi. This part of the formula ghem a mature of the spread within each group parlance/standard gestation /standard error. > calculating a test staticic is really asking the question! is the difference between group means bigger than the random variation that exists between them! Full Ho) and alternative Hai hypotheds are short statements that always state prior to carrying out a statistical best, different than the typical research hypothesis that are probably used to, They are just one simple sentence each. Ho assumes that there is ND significant difference between two groups, while Ha assumes that there is a significant difference. Ho will always just be something like "mean of group 1 = mean of Ha will change depending on the context. in a one tailed test, It is basically have an idea of what will be seen, for example, that a now CO medication wil significantly IMPROVE a certain medical condition, In the cme of a ne-tiled test, use either . or s in the Ha, Mating "mean of group 1 we mown of goup 2. " For two tailed tests, it might not have an idea to see if any differences exist between the two groups. For these tests, It will always be inings, never > or a, For example, "mean 1 = moan 1" also use a big, frightening table to get something known as your "critical t-value. " For any calculated t-valve greater than this, reject Ho and consider groups significantly different; any calculated t value less than this, and fail to reject to, claiming that not enough evidence cutth to sugjed a significant difference between the heap . from the conclusion, move into determining whether the p- value s = 0.05. or . 0.03, p-values are the "probability that these results are just due to random chance. " Random chance to its everywhere, and there is alein the possibility that the ofference you observed between groups is just luck after all, you will almost never get two means that are exactly the wine, There will always be at least some sort of difference. and the p-value lets in know how likely it is that me would observe a difference this barge simply by chance. . t:calc . t out . REJECT How pavalue - 0.03 forference between means so big that the probability that this is simply candoan chance is small, less than 510 . bcalc . biont . FAR. TO REJECT Ho .# p value = 0.05 idifference between means not enough to overcome the random variation within the groups; chance that sosing the difference in juif luck is lange, more than 95) The One-Sample t-Test What are the four steps in an experiment! 1. State the hypothesis what is the nul hypothesis ihop what is the alternative hypothesis [Hall 2. Test the null hypothesis at the desired p value thing the appropriate Matistical test: Since the problem compares a single sample mean to a population mean where the population SD is known, we can use the one sample T.best I State your stathtical conclung regarding the null hypothesis .e.. reject in fail to reject For . Provide an interpretation of your statistical conclusion When is the One Sample t Test usedl 1. To determine if the difference between a single sample mean and a known or mil inated population mean ter pl is watistically significant 2. When the population SD for el is unanown I. When the data are of at least interval of ratio scalesCORRELATION ANALYSIS SIMPLE LINEAR REGRESSION A scatter plut is a graphical representation of the relation between two or more inriablet, In the scatter plot of two variables s and y, each point mm the plut is an by pair Regpeision and Correlation is use to describe the variation in one of rate #. The variation in the mom of the squared deviation of a variables b. The warsation a the numerator of the variance of a sample: Te C. Both the variation and the mirurge ife mansur of the digeniin Home win prices and square footage Home sale prices grantkcal annj v. square footage for a sampin of 34 home sales in September 1013 in St. Uncicle County, price HPD,OQO 500 1.800 15830 2000 1500 3808 The covariance between two random variables is a statistical memure of the degree to wich the two variables move together. . The covariance captives hire one variable is different from its main m the other variable is different from its mean. b. A positive covariance ind cities that the variables tend to move together, a negative crarance indicates that the variables tend to more in opposite direction. C. The covariance is calculated as the ratio of the covariation to the sample lee leth one: nology & a in the f* observation on variable s " is the mean of the variable s observations Y . in the P observation on variable y You the mean of the variable y observation d. The actual value of the covariance h but meaninghi becaine it is affected by the scale of the two variables. That is why we calculate the correlation coefficient . to make something interpretable from the covariance information, . The correlation coefficient, F. in a measure of the strength of the relationship between or wrong merubles Forte: Correlation does not Imply cination, We may say that two variables & and Y are correlated, but that does not main this K causes T or that Y causes & - they simply we related or amiciated with one mother. Calculations Fo coparace between a bed yistandard deviation of pitstandard N-1 N.1Calculating the comelation conflict -1.50 SA 01 35 12.25 1401 40 2.35 43 46 - 19519 - 135 459 -OATS I. The type of relationship is represented by the comelation coefficients Foul perfect powthe correlation -for : 0 par tive ilationship . 0 no relationship Dare Torative relationship it . I perfect negative correlation In, You can determine the degree of comelation by looking at the scumer prachi. If the relation is up and there is punitive correlation, If the relation downward there is negates correlation, Ill. The correlation coefficient is bound by I and =1. The laser the roethcient to -1 of =1, the stronger as the correlation. Is. With the eureprim of the extremes (that is, Fellforre -1), we Consol really talk about the wrench of a fclinicming indicated by the correlation coefficient without a stantical feat of Ugnifusion. ". The hypatbein of interest regarding the population correlation . are: Hull hypetheits In other wind. there's to correlation bartween the two ABermanten hyporhein In other works, thane is a compation between the ies wi, The tes pratinic in 1-puntuted with N-2 devices of freedom In the previous example. Col 1 = 10 13035 -1507 V1-0.4753 wil. To make a decision, compare the calculated t-statistic with the critical t Matutic for the appropriate dog ees of freedom andProblem! `Suppose the correlation coefficient in D.7 and the number of observations is 11. What is the calculated test bathuicl is the significant corplation thing a 36 Level of significance] Solution Hypothesi Calculated -atathere! 107 .127 0.2.30 logy Degrees of freedom . 12-2 - 10 The critical t value for a 5% level of significance and 10 degrees of freedom in 1 043. Therefore, we conclude that there in no correlation (1.1180] falls bortwoon the two critical columns of 1043 and .2. 0427. F. An outlier is an extreme value of a variable. The outer may be quite large or small patice large and small are defined relative to the rest of the L An outber may affect the sample if ativlies, much as a correlation coefficient. It is possible for an outlier to affect the rewit, for example. wich that we conclude that there he significant relation when in fact there it. rame of to conclude that there is no relation when in fact there is a relation. . The researcher mul asriche judgment and ca.time) when deciding whether to include w exdude in observation. . Sourbois correlation is the apperance of a relationhip when in fact there is m relation, Outtien may trust in spurious correlation The correlation cnet lk west does not indicate acauud relationship. Certain data Were may be highly correlated, but not meorsarly a result of Simple regenion 1. Regression is the analysis of the relation belaced one anable and CO Ent squires regresson and ordinary leant squares jotsa . The purpose is to gaplain the variation in a variable itfat in how a warisble differ from its mean valued ining the wartation in one or Fore other variable. b. Supporte we want to deicribse, explain, or predict city a variable differs from its mean, Let the I" steeration on this wartable be represented at Yo and let n indicate the number of observation. The viation is Y, i that we want to mplain) ha! Marsation of Y c. The least square principle is that the fog milen Iing h determined by minimizing the tum of the squares of the vertical distances between the actual Y wines and the predicted wieint 25/35 Ino i lime is it through the XY points such that the sum of the squared residuals ithat is, the sum of the soured the vertical distance Lol to minimind 1. The marbles in a mint want relation coming of dependent and a. The dependent variable in the variable whose variation is being cexplained by the other variableis). Also referred to as the explained variable, the endogenous wartable, or the predicted variable b. The independent variable i the variable chine veriation is uned in captain that of the do pain canable, Mo referred to as the explanatory variable, the sungenous variable, or the predicting auriable. CO C. The parameters in a sample repression equation are the slope (b. where Mi A itsch manvation on the dependent variable ", in itsch observation on the independent variable, bull the Intercept. by h the slope coefficient,Hint Think of the regression line as the acmrage of the relationship between the independent variableisj and the dependent variable The qrural representi the distance an pinomed waive at the dependent variables ite., YI is way from the average relationsip in depicted by the regression line d. The slope, by, b the change in " for a given one unit change n 1. The sage can be poutive, bejative, or rem, calculated as! N-1 N-1 Suppose that 50-19 -450 Then Coli 1.090 -2.2321 . The intercept, boy is the line's interjection with the Y-aus at X-Q The intercept can be positive, negative, or pero. The intercept is calculated ast 1. Linear regression assumes the following a, A linear relationship exists between dependent and independent Hoon: if the relation is not linear, Rimay be pou ble to transform one or both variables so that there is a linear relation b. The independent variable io uncerelabed with the miniaing that In the independent variable in not random, C. The expected value of the disturbance term is zero; that is Ciej-0 d. There is a comband waflanon of the driturbanin form; that i, the diverbance or residual terms are all down from a distribution with an Identical varlange. In other monk, the disturbance terms are homoikedasteric. TA violation of this is referred to as heteroskedasticity. | 27/35 disturbance for one obiersackin is not correlated with that of mess othervaticat. [A violation of this h relented to as corocormackon ] 4. The standard error of the estimate, SEE, jalso referred to as the standard error of the residual of standard erce of the regretion and often indicated an ) in the standard deviation al predicted dependent variable values shout the estimated repression line. 5. Standard error of the estimate (E!) SEE IN Z andExample 1. continued Cranlier the following cinereations on & and re Nology Y = 25.559 + 1. 1518 and the residualy are calculated as 12 39.52 1.0.18 13 54 AL.01 12.94 168 65 10 37.44 10.56 111.49 47 10.75 115 50 70 4:12 20 -UM 1:92.56 15 -15.31 214.45 40 51.TO -11.70 35 70 76 37 52.09 15.81 CO S .13 43/ 8 - 226 70 SEE /124 70 - 15 04 1. The standard error of the estimate helps us gauge the fit of the repression lines that is, how well we five described the variation in the dependent care bin. 4. The smaller the Handand error, the better the fit, It. The standard enor of the estimate is a measure of close the estimated values jining the mat mated reyprision, the S'1 are to the actual valier the Y's. ill. The &'s (the disturbance terms, the residual) are the vertical distance between the observed value of Y and that predicted by the equation, the SA. Is. The E's are in the same torme putit of manure at the Y's ie. Top dollar, rounds, billamsi. 6. The confficient of determination, A , in the percentage of variation In the dependent variable purlation of Y. I or the sum of square total, 5ST) explained by the Independent variableist. I, The coefficient of determination in calculated at 55 Total warisgon 29/35 b, An R al D 4 indicates that the independent variables mup unit of the variation in the dependent wristte. Example J. continued Continuing the prevings rey ration example, we can calculate the Wit 12 40.50 29.16 15 50 10 70 20 166.56 -15 C 40 2.56 51.70 -11 70 10210 136 89 15 15 40.56 41 38 70.26 Total 436 2,34240 416:081-(141343/ 1342 47) = 1-07743 - 23-57% J. & confidence interval h the range of regnasion coefficient values for a given value ritmate of the coefficient and a given imd of probability. wave t is the aticd tyke for the ideded continenos Read If there me 30 depress The hopenation of the on die've hood's fours s mi teal dot me to me all I. as the Mandand error of the estimate the vinability of the data about the rey cation line; roca, the confidence wider. is other wrath, the more variable the data, the lets confident will be when using the mywant mold to eudictate the coffee t. M. The standard more of the conf ficant in the spate root of the ratio of the variance of the regression to the variation in the independent 4. Hypothesi teilung; an individual explanatory variable In toy the hypoth rin of the dope coefficient gthat is, in see whether the eirimuted slope is equal to a hypothesized value. C D. He h . D. we calculive a t dutribused statistics i. The int itmink a t dotributed with N k.I degreei of freedom frumber of observations Pli. lem the number of independent b. If the e statistic is greater mon the critical t value for the appropriate degrees of freedom, in less than the critical t value for a reyltire alope we can way that the slope coefficient and ferme frion the hypothesined value, by Note: The formula for the standard erio of the coefficient has the carsation of the independent variable in the denominator, not the variance The vinlance . variation / n.1. the if there is no relation between the dependent and iindependent. wintitle, the love cooll chat, by could be men. 30/36 bi=0 A zero singe indicates that there h pactune in T for a given dung A mere Nope Indicates that there is myrelationship between T and X d. To cent whether on independent variable explains the wartation in the dependent variable. the toootheris that in tested is whether the ilope is form H worsen the illumative (what you conclude if youreject the nil, HeH.: b,= 0 This alternative hypothesis is referred to as a two-sided hypothesis. This means that we reject the null if the observed slope is different from zero in either direction (positive or negative). e. There are hypothesis in economics that refer to the sign of the relation between the dependent and the independent variables. In this case, the alternative is directional (> or