Answered step by step
Verified Expert Solution
Question
1 Approved Answer
TTM = Trailing Twelve Months. 5YA = 5-Year Average. MRQ = Most Recent Quarter. ANN = Annually. Question : Evaluate the financial performance and growth


TTM = Trailing Twelve Months.
5YA = 5-Year Average.
MRQ = Most Recent Quarter.
ANN = Annually.
Question :
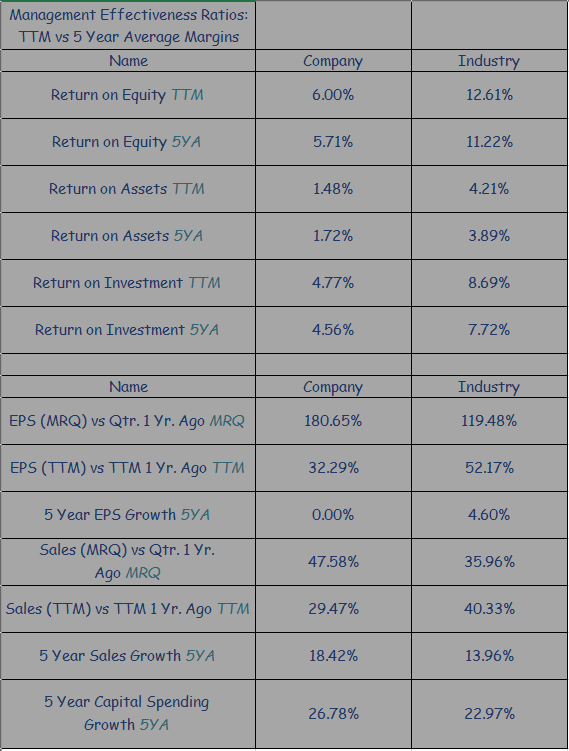
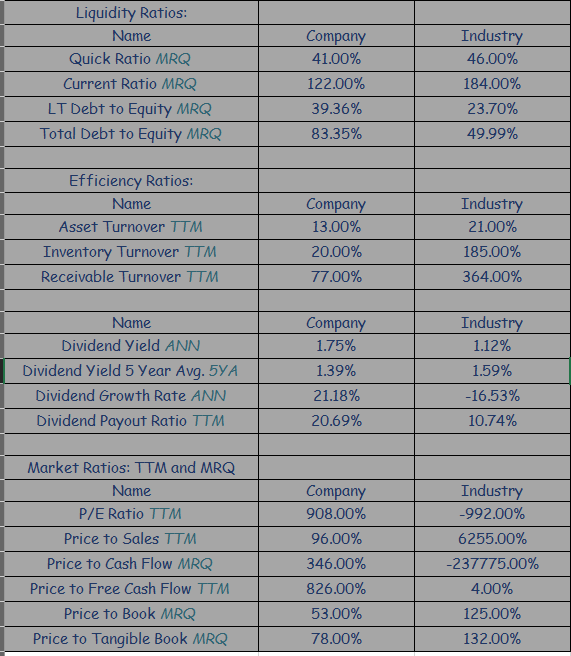
Evaluate the financial performance and growth prospects of Company. Using the selected financial ratios provided, analyze these key financial metrics to write a report about the financial health of the group that should be submitted to the board of directors.
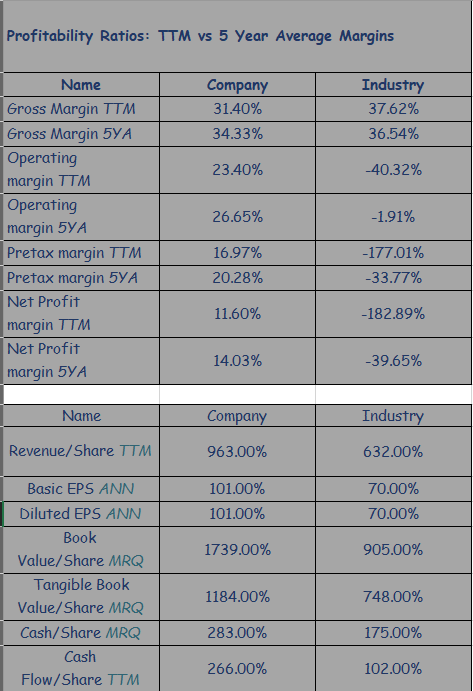
Profitability Ratios: TTM vs 5 Year Average Margins \begin{tabular}{|l|c|c|} \hline \multicolumn{1}{|c|}{ Name } & Company & Industry \\ \hline Gross Margin TTM & 31.40% & 37.62% \\ \hline GrossMargin5YA & 36.54% \\ \hline OperatingmarginTTM & 34.33% & 40.32% \\ \hline Operatingmargin5YA & 23.40% & 1.91% \\ \hline Pretax margin TTM & 26.65% & 177.01% \\ \hline Pretax margin 5YA & 16.97% & 33.77% \\ \hline NetProfitmarginTTM & 20.28% & 182.89% \\ \hline NetProfitmargin5YA & 11.60% & 39.65% \\ \hline \end{tabular} \begin{tabular}{|c|c|c|} \hline Name & Company & Industry \\ \hline Revenue/Share TTM & 963.00% & 632.00% \\ \hline Basic EPS ANN & 101.00% & 70.00% \\ \hline Diluted EPS ANN & 101.00% & 70.00% \\ \hline BookValue/ShareMRQ & 1739.00% & 905.00% \\ \hline TangibleBookValue/ShareMRQ & 1184.00% & 748.00% \\ \hline Cash/Share MRQ & 283.00% & 175.00% \\ \hline CashFlow/ShareTTM & 266.00% & 102.00% \\ \hline \end{tabular} Profitability Ratios: TTM vs 5 Year Average Margins \begin{tabular}{|l|c|c|} \hline \multicolumn{1}{|c|}{ Name } & Company & Industry \\ \hline Gross Margin TTM & 31.40% & 37.62% \\ \hline GrossMargin5YA & 36.54% \\ \hline OperatingmarginTTM & 34.33% & 40.32% \\ \hline Operatingmargin5YA & 23.40% & 1.91% \\ \hline Pretax margin TTM & 26.65% & 177.01% \\ \hline Pretax margin 5YA & 16.97% & 33.77% \\ \hline NetProfitmarginTTM & 20.28% & 182.89% \\ \hline NetProfitmargin5YA & 11.60% & 39.65% \\ \hline \end{tabular} \begin{tabular}{|c|c|c|} \hline Name & Company & Industry \\ \hline Revenue/Share TTM & 963.00% & 632.00% \\ \hline Basic EPS ANN & 101.00% & 70.00% \\ \hline Diluted EPS ANN & 101.00% & 70.00% \\ \hline BookValue/ShareMRQ & 1739.00% & 905.00% \\ \hline TangibleBookValue/ShareMRQ & 1184.00% & 748.00% \\ \hline Cash/Share MRQ & 283.00% & 175.00% \\ \hline CashFlow/ShareTTM & 266.00% & 102.00% \\ \hline \end{tabular}Step by Step Solution
There are 3 Steps involved in it
Step: 1

Get Instant Access to Expert-Tailored Solutions
See step-by-step solutions with expert insights and AI powered tools for academic success
Step: 2

Step: 3

Ace Your Homework with AI
Get the answers you need in no time with our AI-driven, step-by-step assistance
Get Started


