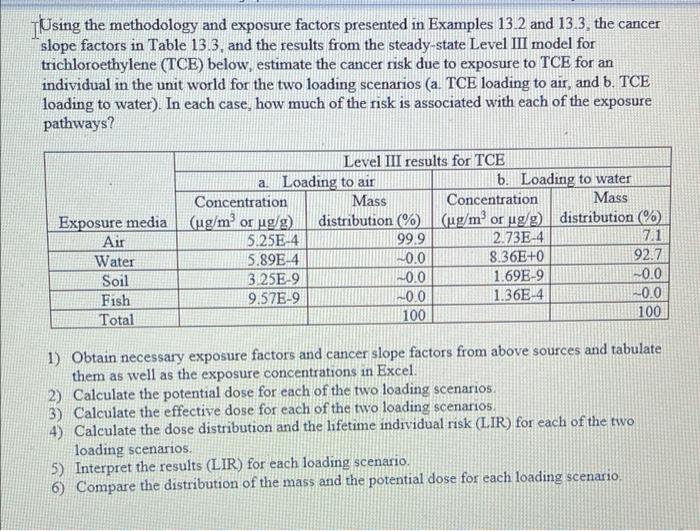
TUsing the methodology and exposure factors presented in Examples 13.2 and 13.3, the cancer slope factors in Table 13.3, and the results from the steady-state Level III model for trichloroethylene (TCE) below, estimate the cancer risk due to exposure to TCE for an individual in the unit world for the two loading scenarios (a TCE loading to air, and b. TCE loading to water). In each case, how much of the risk is associated with each of the exposure pathways? Level III results for TCE a. Loading to air b. Loading to water Concentration Mass Concentration Mass Exposure media (ug/m? or ug/g) distribution (%) (ug/m or ug/g) distribution (%) Air 5.25E-4 99.9 2.73E-4 7.1 Water 5.89E-4 -0.0 8.36E+0 92.7 Soil 3.25E-9 -0.0 1.69E-9 -0.0 Fish 9.57E-9 -0.0 1.36E-4 -0.0 Total 100 100 1) Obtain necessary exposure factors and cancer slope factors from above sources and tabulate them as well as the exposure concentrations in Excel. 2) Calculate the potential dose for each of the two loading scenarios. 3) Calculate the effective dose for each of the two loading scenarios. 4) Calculate the dose distribution and the lifetime individual risk (LIR) for each of the two loading scenarios 5) Interpret the results (LIR) for each loading scenario. 6) Compare the distribution of the mass and the potential dose for each loading scenario, TUsing the methodology and exposure factors presented in Examples 13.2 and 13.3, the cancer slope factors in Table 13.3, and the results from the steady-state Level III model for trichloroethylene (TCE) below, estimate the cancer risk due to exposure to TCE for an individual in the unit world for the two loading scenarios (a TCE loading to air, and b. TCE loading to water). In each case, how much of the risk is associated with each of the exposure pathways? Level III results for TCE a. Loading to air b. Loading to water Concentration Mass Concentration Mass Exposure media (ug/m? or ug/g) distribution (%) (ug/m or ug/g) distribution (%) Air 5.25E-4 99.9 2.73E-4 7.1 Water 5.89E-4 -0.0 8.36E+0 92.7 Soil 3.25E-9 -0.0 1.69E-9 -0.0 Fish 9.57E-9 -0.0 1.36E-4 -0.0 Total 100 100 1) Obtain necessary exposure factors and cancer slope factors from above sources and tabulate them as well as the exposure concentrations in Excel. 2) Calculate the potential dose for each of the two loading scenarios. 3) Calculate the effective dose for each of the two loading scenarios. 4) Calculate the dose distribution and the lifetime individual risk (LIR) for each of the two loading scenarios 5) Interpret the results (LIR) for each loading scenario. 6) Compare the distribution of the mass and the potential dose for each loading scenario


