Question
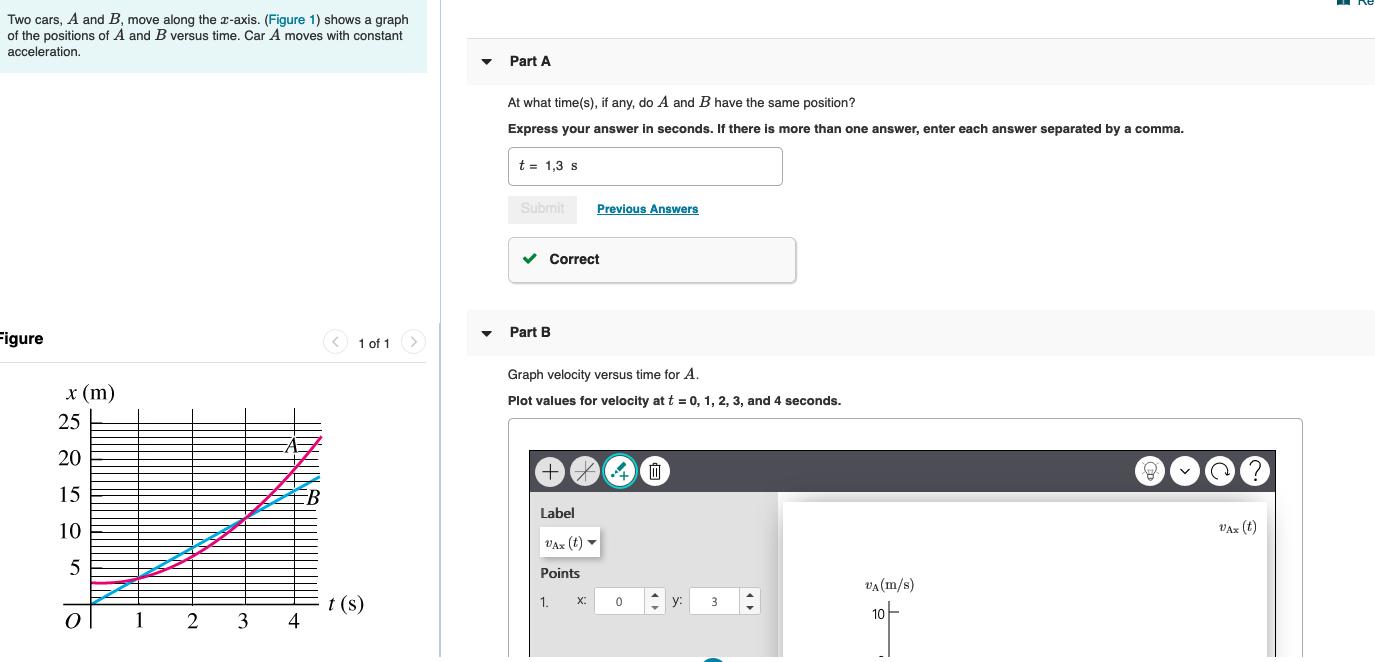
Two cars, A and B, move along the x-axis. (Figure 1) shows a graph of the positions of A and B versus time. Car A

Two cars, A and B, move along the a-axis. (Figure 1) shows a graph of the positions of A and B versus time. Car A moves with constant acceleration. Part A At what time(s), if any, do A and B have the same position? Express your answer in seconds. If there is more than one answer, enter each answer separated by a comma. t = 1,3 s Submit Previous Answers v Correct Part B Figure ( Graph velocity versus time for A. x (m) Plot values for velocity at t = 0, 1, 2, 3, and 4 seconds. 25 20 4 15 Label 10 VAx (t) VAx (t) - 5 Points VA(m/s) : y: t (s) 4 1. X: 3 10- 1 3 2.
Step by Step Solution
3.42 Rating (161 Votes )
There are 3 Steps involved in it
Step: 1
PARTA from the xt it graph that t 1 secomd t 3sec have same va...
Get Instant Access to Expert-Tailored Solutions
See step-by-step solutions with expert insights and AI powered tools for academic success
Step: 2

Step: 3

Ace Your Homework with AI
Get the answers you need in no time with our AI-driven, step-by-step assistance
Get StartedRecommended Textbook for
University Physics with Modern Physics
Authors: Hugh D. Young, Roger A. Freedman, Lewis Ford
12th Edition
978-0321501479, 9780805321876, 321501470, 978-0321501219
Students also viewed these Accounting questions
Question
Answered: 1 week ago
Question
Answered: 1 week ago
Question
Answered: 1 week ago
Question
Answered: 1 week ago
Question
Answered: 1 week ago
Question
Answered: 1 week ago
Question
Answered: 1 week ago
Question
Answered: 1 week ago
Question
Answered: 1 week ago
Question
Answered: 1 week ago
Question
Answered: 1 week ago
Question
Answered: 1 week ago
Question
Answered: 1 week ago
Question
Answered: 1 week ago
Question
Answered: 1 week ago
Question
Answered: 1 week ago
Question
Answered: 1 week ago
Question
Answered: 1 week ago
Question
Answered: 1 week ago
Question
Answered: 1 week ago
Question
Answered: 1 week ago
Question
Answered: 1 week ago
View Answer in SolutionInn App


