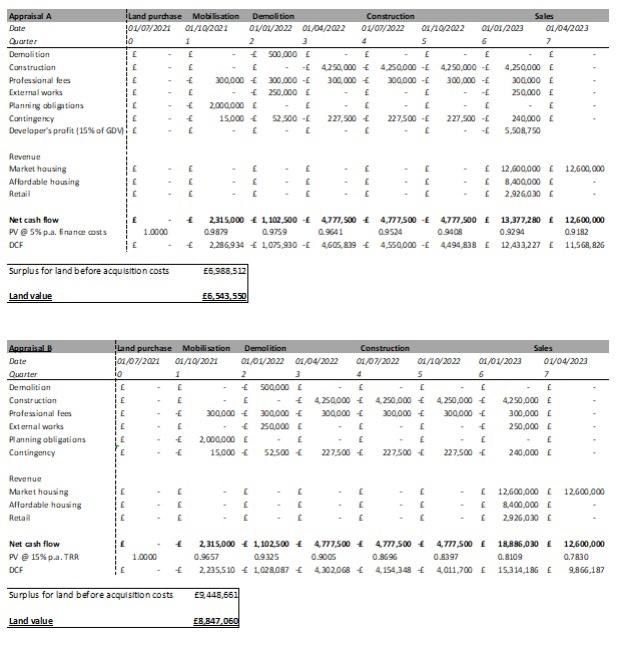
Two different types of appraisals done here. Discuss differnces in the estimates of the land values.
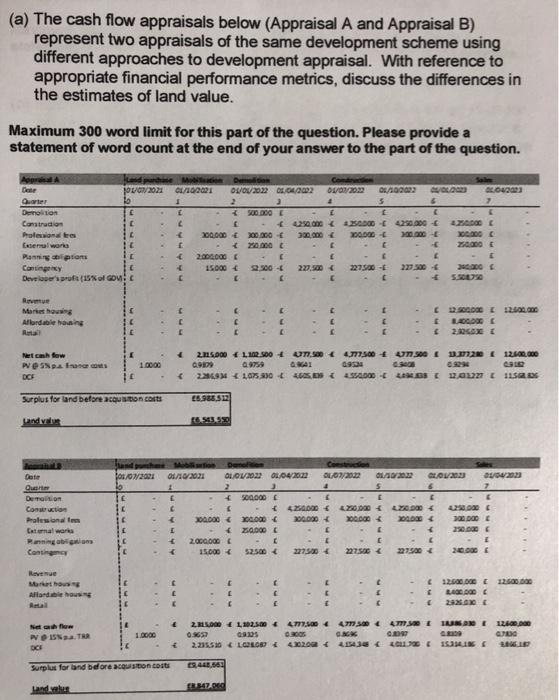
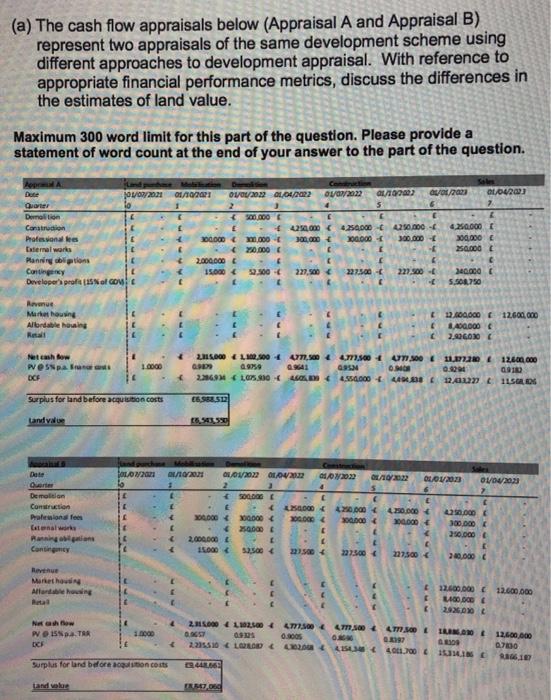
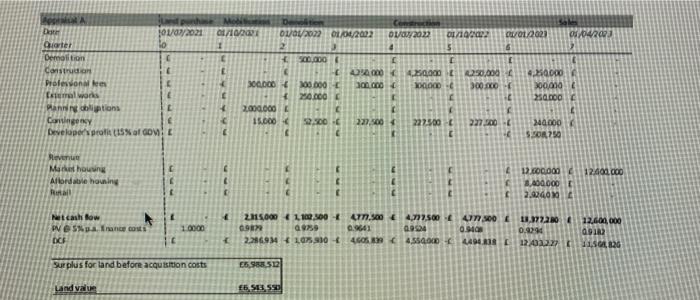
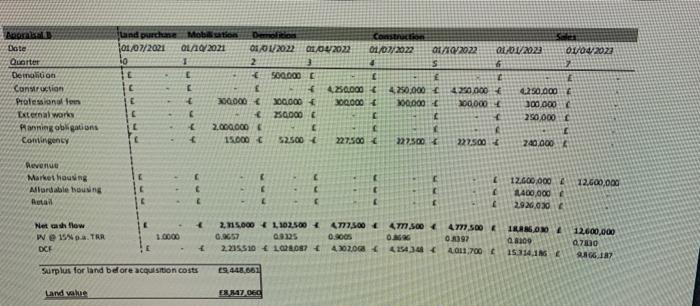
(a) The cash flow appraisals below (Appraisal A and Appraisal B) represent two appraisals of the same development scheme using different approaches to development appraisal. With reference to appropriate financial performance metrics, discuss the differences in the estimates of land value. Maximum 300 word limit for this part of the question. Please provide a statement of word count at the end of your answer to the part of the question. AA La Mi JOVOV2021 1/10/2001 De OLVO/2032 DE00002 2 2 Com O/02/2012 04/109022 6 2004 - 4.250.000 300.000 00.000 Demolition Construir Polares Cemal worla Planning prins Continger Develor's profilo 42. X. ZODO 0.00 200.000 3 Quarter Demolition Construction Professional lo External works Manning obligations Contingency Land purchase Mobition Demolition Construction 101/07/2021 01/20/2021 GIOV20220.00 2022 01/01/2022 10 2 IC 500.000 C 250.000 4.250.000 E 200.000 0.000 100.000 300.000 250.000 2.000.000 15.000 $2.500 227.500 222500 420.000 200,000 4.290.000 300.000 250.000 3 3 3 227.500 240.000 6 Revenue Market houng Vark al 4 RLG 12.600,000 12.600.000 4 1400 000 2926.030 3 3 9 3 3 ) Net cash flow www.TAR OCH 2. 115.000 1,102.500 0.6657 2.235.510 LOS 777.500 0.soos 402.0GB 4777.500 O. 415434 4777.500 4 0397 021,700 1RROR a 3000 15 14.11 + 12,600,000 0.7130 16.12 Surplus for land beore acquisition costs S. 448,682 Land value ERILIZO Appraisal A Land purchase Mobilisation Demolition Construction Sales Date 01/07/2021 di 10/2001 01/01/2022 01/04/2022 01/07/2022 01/102022 01/01/2022 01/04/2023 Quarter 10 1 2 3 4 5 6 7 Demolition E 500.000 f E Construction E E E -E 4.250.000 420.000 4250 000 - 4,250,000 Professional lees E + 300.000 300.000 - 300.000 300.000 - 300.000 300.000 External works 250.000 - 250.000 Planning obligations 2,000,000 E Contingency 15.000 $2.500 - 227,500 227.500 - 227.500 - 240,000 Developer's profit (45% of Gow - S.508.750 Revenue Market housing Allardable housing Retail 12.600.000 12,600,000 8.400,000 [2.926,030 Net cash flow pv @5%.a. finance costs DCF 1.0000 225.000 1,102,500 47,500 4.772,500 4771 900 13.377,280 12,600,000 09879 09182 2.286.934 + 1,075930 4.605,89 4.550.000 4.494 839 E 12,433,227 [ 11.568,826 09759 09524 Surplus for land before acquisition costs E6.988.512 Land value 6,543,550 Appraisal B Date Quarter Demolition Construction Professional fees External works Planning obligations Contingency Land purchase Mobilisation Demolition Construction Sales 01/07/2021 01/10/2021 01/01/2022 01/04/2022 01/07/2022 01/10/2022 01/01/2023 01/04/2023 10 1 2 3 5 6 7 E E 500.000 E E E E E 420.000 4.250.000 4,250,000 4,250,000 E 300.000 300.000 300.000 200.000 300.000 300,000 250,000 - - 250.000 E 2.000.000 E E 15.000 52.500 227.500 227500 227.500 240.000 Revenue Market housing Alfordable housing Retail 12.600.000 12.500.000 8,400,000 1 2926.030 + Net cash flow PV @ 15% pa. TRR DCF 1.0000 235,000 1,102,500 4777.500 + 47.500 4,7 500 18,836,030 12,600,000 0.9657 09325 0.9005 0.8696 0.8397 0.8109 0.7830 2.235,50 1.028.087 4202058 4154.348 4.011.700 15,314,186 9,866,187 Surplus for land before acquisition costs 59,448,661 Land value 18.847,060 (a) The cash flow appraisals below (Appraisal A and Appraisal B) represent two appraisals of the same development scheme using different approaches to development appraisal. With reference to appropriate financial performance metrics, discuss the differences in the estimates of land value. Maximum 300 word limit for this part of the question. Please provide a statement of word count at the end of your answer to the part of the question. AA La Mi JOVOV2021 1/10/2001 De OLVO/2032 DE00002 2 2 Com O/02/2012 04/109022 6 2004 - 4.250.000 300.000 00.000 Demolition Construir Polares Cemal worla Planning prins Continger Develor's profilo 42. X. ZODO 0.00 200.000 3 Quarter Demolition Construction Professional lo External works Manning obligations Contingency Land purchase Mobition Demolition Construction 101/07/2021 01/20/2021 GIOV20220.00 2022 01/01/2022 10 2 IC 500.000 C 250.000 4.250.000 E 200.000 0.000 100.000 300.000 250.000 2.000.000 15.000 $2.500 227.500 222500 420.000 200,000 4.290.000 300.000 250.000 3 3 3 227.500 240.000 6 Revenue Market houng Vark al 4 RLG 12.600,000 12.600.000 4 1400 000 2926.030 3 3 9 3 3 ) Net cash flow www.TAR OCH 2. 115.000 1,102.500 0.6657 2.235.510 LOS 777.500 0.soos 402.0GB 4777.500 O. 415434 4777.500 4 0397 021,700 1RROR a 3000 15 14.11 + 12,600,000 0.7130 16.12 Surplus for land beore acquisition costs S. 448,682 Land value ERILIZO Appraisal A Land purchase Mobilisation Demolition Construction Sales Date 01/07/2021 di 10/2001 01/01/2022 01/04/2022 01/07/2022 01/102022 01/01/2022 01/04/2023 Quarter 10 1 2 3 4 5 6 7 Demolition E 500.000 f E Construction E E E -E 4.250.000 420.000 4250 000 - 4,250,000 Professional lees E + 300.000 300.000 - 300.000 300.000 - 300.000 300.000 External works 250.000 - 250.000 Planning obligations 2,000,000 E Contingency 15.000 $2.500 - 227,500 227.500 - 227.500 - 240,000 Developer's profit (45% of Gow - S.508.750 Revenue Market housing Allardable housing Retail 12.600.000 12,600,000 8.400,000 [2.926,030 Net cash flow pv @5%.a. finance costs DCF 1.0000 225.000 1,102,500 47,500 4.772,500 4771 900 13.377,280 12,600,000 09879 09182 2.286.934 + 1,075930 4.605,89 4.550.000 4.494 839 E 12,433,227 [ 11.568,826 09759 09524 Surplus for land before acquisition costs E6.988.512 Land value 6,543,550 Appraisal B Date Quarter Demolition Construction Professional fees External works Planning obligations Contingency Land purchase Mobilisation Demolition Construction Sales 01/07/2021 01/10/2021 01/01/2022 01/04/2022 01/07/2022 01/10/2022 01/01/2023 01/04/2023 10 1 2 3 5 6 7 E E 500.000 E E E E E 420.000 4.250.000 4,250,000 4,250,000 E 300.000 300.000 300.000 200.000 300.000 300,000 250,000 - - 250.000 E 2.000.000 E E 15.000 52.500 227.500 227500 227.500 240.000 Revenue Market housing Alfordable housing Retail 12.600.000 12.500.000 8,400,000 1 2926.030 + Net cash flow PV @ 15% pa. TRR DCF 1.0000 235,000 1,102,500 4777.500 + 47.500 4,7 500 18,836,030 12,600,000 0.9657 09325 0.9005 0.8696 0.8397 0.8109 0.7830 2.235,50 1.028.087 4202058 4154.348 4.011.700 15,314,186 9,866,187 Surplus for land before acquisition costs 59,448,661 Land value 18.847,060


