Question
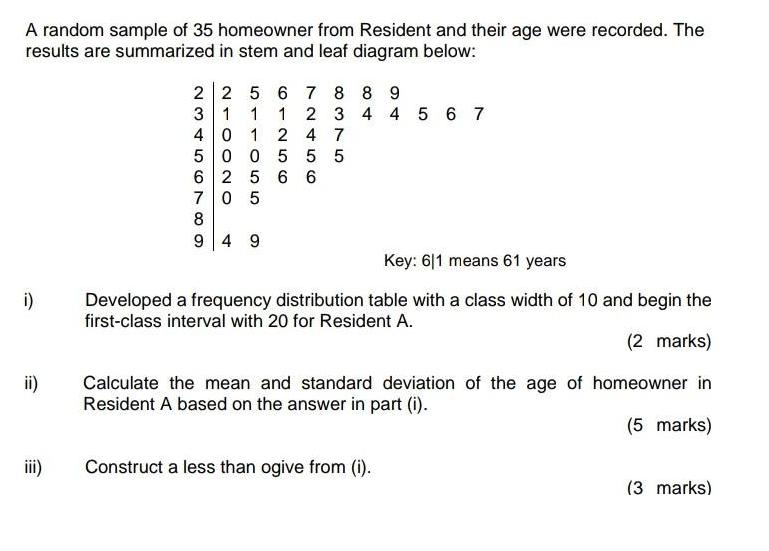
A random sample of 35 homeowner from Resident and their age were recorded. The results are summarized in stem and leaf diagram below: i)

A random sample of 35 homeowner from Resident and their age were recorded. The results are summarized in stem and leaf diagram below: i) ii) iii) 2 3 4 5 0 0 6 2 5 70 5 8 94 9 2 5 6 7 8 8 9 1 2 1 1 0 1 2 3 4 4 5 6 7 47 5 6 6 5 5 Key: 611 means 61 years Developed a frequency distribution table with a class width of 10 and begin the first-class interval with 20 for Resident A. (2 marks) Calculate the mean and standard deviation of the age of homeowner in Resident A based on the answer in part (i). (5 marks) Construct a less than ogive from (i). (3 marks)
Step by Step Solution
3.44 Rating (154 Votes )
There are 3 Steps involved in it
Step: 1
Use the given stem and leaf plot the info may be obtained as follows The distr...
Get Instant Access to Expert-Tailored Solutions
See step-by-step solutions with expert insights and AI powered tools for academic success
Step: 2

Step: 3

Ace Your Homework with AI
Get the answers you need in no time with our AI-driven, step-by-step assistance
Get StartedRecommended Textbook for
Economics Today
Authors: Roger LeRoy Miller
16th edition
132554615, 978-0132554619
Students also viewed these Accounting questions
Question
Answered: 1 week ago
Question
Answered: 1 week ago
Question
Answered: 1 week ago
Question
Answered: 1 week ago
Question
Answered: 1 week ago
Question
Answered: 1 week ago
Question
Answered: 1 week ago
Question
Answered: 1 week ago
Question
Answered: 1 week ago
Question
Answered: 1 week ago
Question
Answered: 1 week ago
Question
Answered: 1 week ago
Question
Answered: 1 week ago
Question
Answered: 1 week ago
Question
Answered: 1 week ago
Question
Answered: 1 week ago
Question
Answered: 1 week ago
Question
Answered: 1 week ago
Question
Answered: 1 week ago
Question
Answered: 1 week ago
Question
Answered: 1 week ago
View Answer in SolutionInn App


