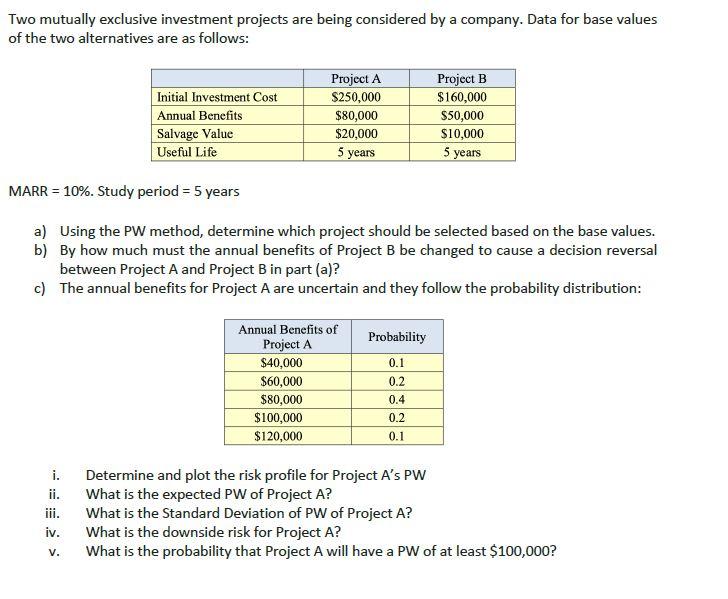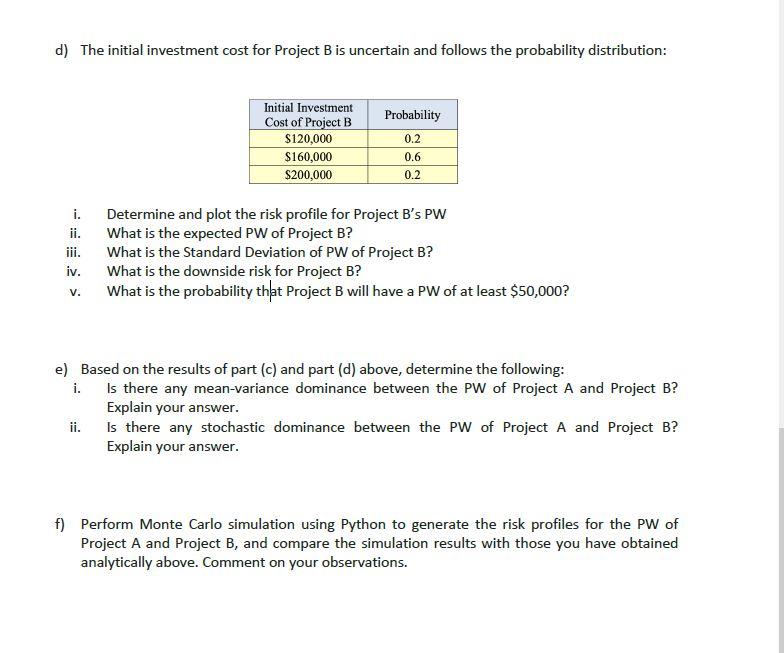

Two mutually exclusive investment projects are being considered by a company. Data for base values of the two alternatives are as follows: Initial Investment Cost Annual Benefits Salvage Value Useful Life Project A $250,000 $80,000 $20,000 5 years Project B $160,000 $50,000 $10,000 5 years MARR = 10%. Study period = 5 years a) Using the PW method, determine which project should be selected based on the base values. b) By how much must the annual benefits of Project B be changed to cause a decision reversal between Project A and Project B in part (a)? c) The annual benefits for Project A are uncertain and they follow the probability distribution: Probability 0.1 Annual Benefits of Project A $40,000 $60,000 $80,000 $100,000 $120,000 0.2 0.4 0.2 0.1 i. iii. iv. Determine and plot the risk profile for Project A's PW What is the expected PW of Project A? What is the Standard Deviation of PW of Project A? What is the downside risk for Project A? What is the probability that Project A will have a PW of at least $100,000? V. d) The initial investment cost for Project B is uncertain and follows the probability distribution: Probability Initial Investment Cost of Project B $120,000 $160,000 $200,000 0.2 0.6 0.2 i. ii. iii. iv. Determine and plot the risk profile for Project B's PW What is the expected PW of Project B? What is the Standard Deviation of PW of Project B? What is the downside risk for Project B? What is the probability that Project B will have a PW of at least $50,000? V. e) Based on the results of part (c) and part (d) above, determine the following: i. Is there any mean-variance dominance between the PW of Project A and Project B? Explain your answer. ii. Is there any stochastic dominance between the PW of Project A and Project B? Explain your answer. f) Perform Monte Carlo simulation using Python to generate the risk profiles for the PW of Project A and Project B, and compare the simulation results with those you have obtained analytically above. Comment on your observations. Two mutually exclusive investment projects are being considered by a company. Data for base values of the two alternatives are as follows: Initial Investment Cost Annual Benefits Salvage Value Useful Life Project A $250,000 $80,000 $20,000 5 years Project B $160,000 $50,000 $10,000 5 years MARR = 10%. Study period = 5 years a) Using the PW method, determine which project should be selected based on the base values. b) By how much must the annual benefits of Project B be changed to cause a decision reversal between Project A and Project B in part (a)? c) The annual benefits for Project A are uncertain and they follow the probability distribution: Probability 0.1 Annual Benefits of Project A $40,000 $60,000 $80,000 $100,000 $120,000 0.2 0.4 0.2 0.1 i. iii. iv. Determine and plot the risk profile for Project A's PW What is the expected PW of Project A? What is the Standard Deviation of PW of Project A? What is the downside risk for Project A? What is the probability that Project A will have a PW of at least $100,000? V. d) The initial investment cost for Project B is uncertain and follows the probability distribution: Probability Initial Investment Cost of Project B $120,000 $160,000 $200,000 0.2 0.6 0.2 i. ii. iii. iv. Determine and plot the risk profile for Project B's PW What is the expected PW of Project B? What is the Standard Deviation of PW of Project B? What is the downside risk for Project B? What is the probability that Project B will have a PW of at least $50,000? V. e) Based on the results of part (c) and part (d) above, determine the following: i. Is there any mean-variance dominance between the PW of Project A and Project B? Explain your answer. ii. Is there any stochastic dominance between the PW of Project A and Project B? Explain your answer. f) Perform Monte Carlo simulation using Python to generate the risk profiles for the PW of Project A and Project B, and compare the simulation results with those you have obtained analytically above. Comment on your observations


