___. _____ _______'__ ___ _ _ -u- ___ Consider H0: ,u = 38 versus H11}; > 38. A random sample of 35 observations taken from
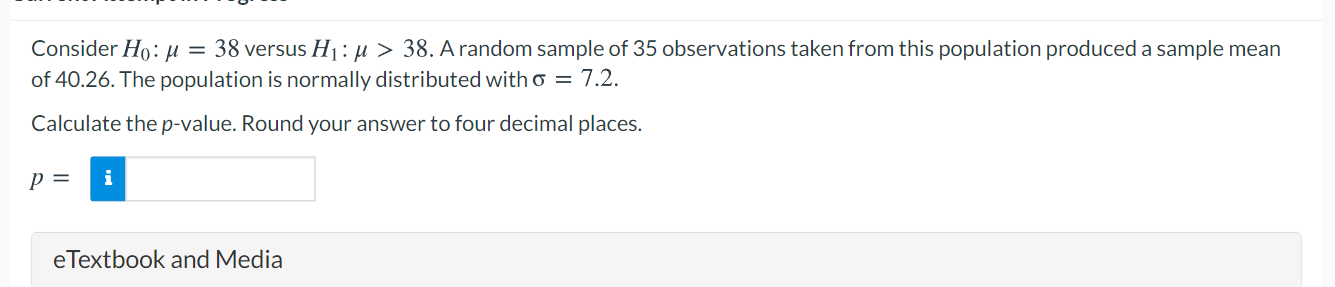
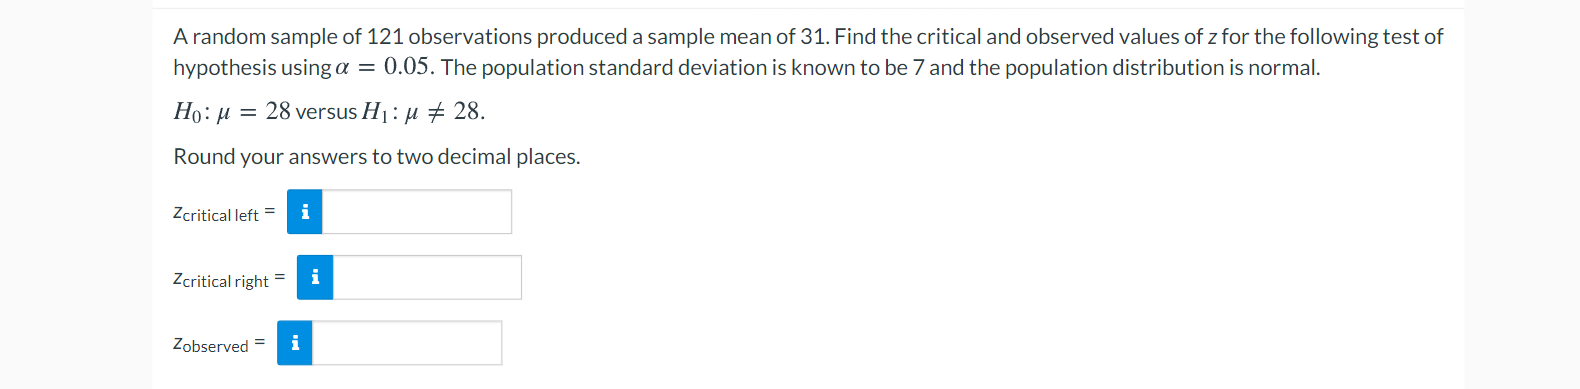
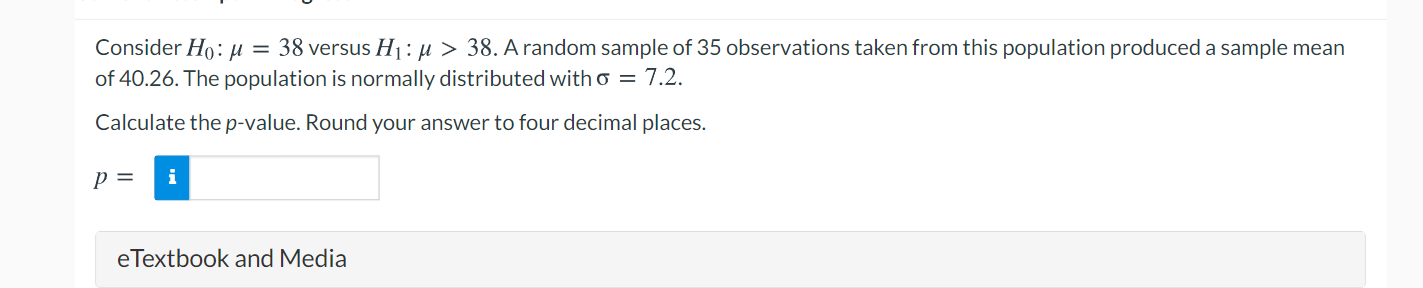
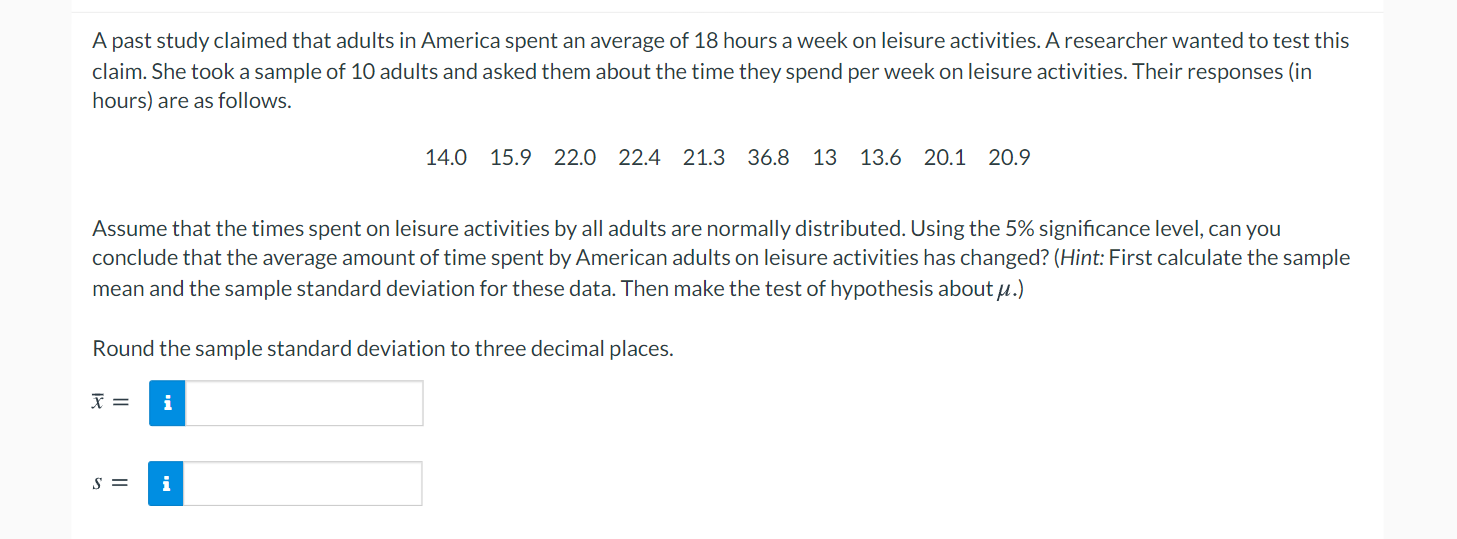
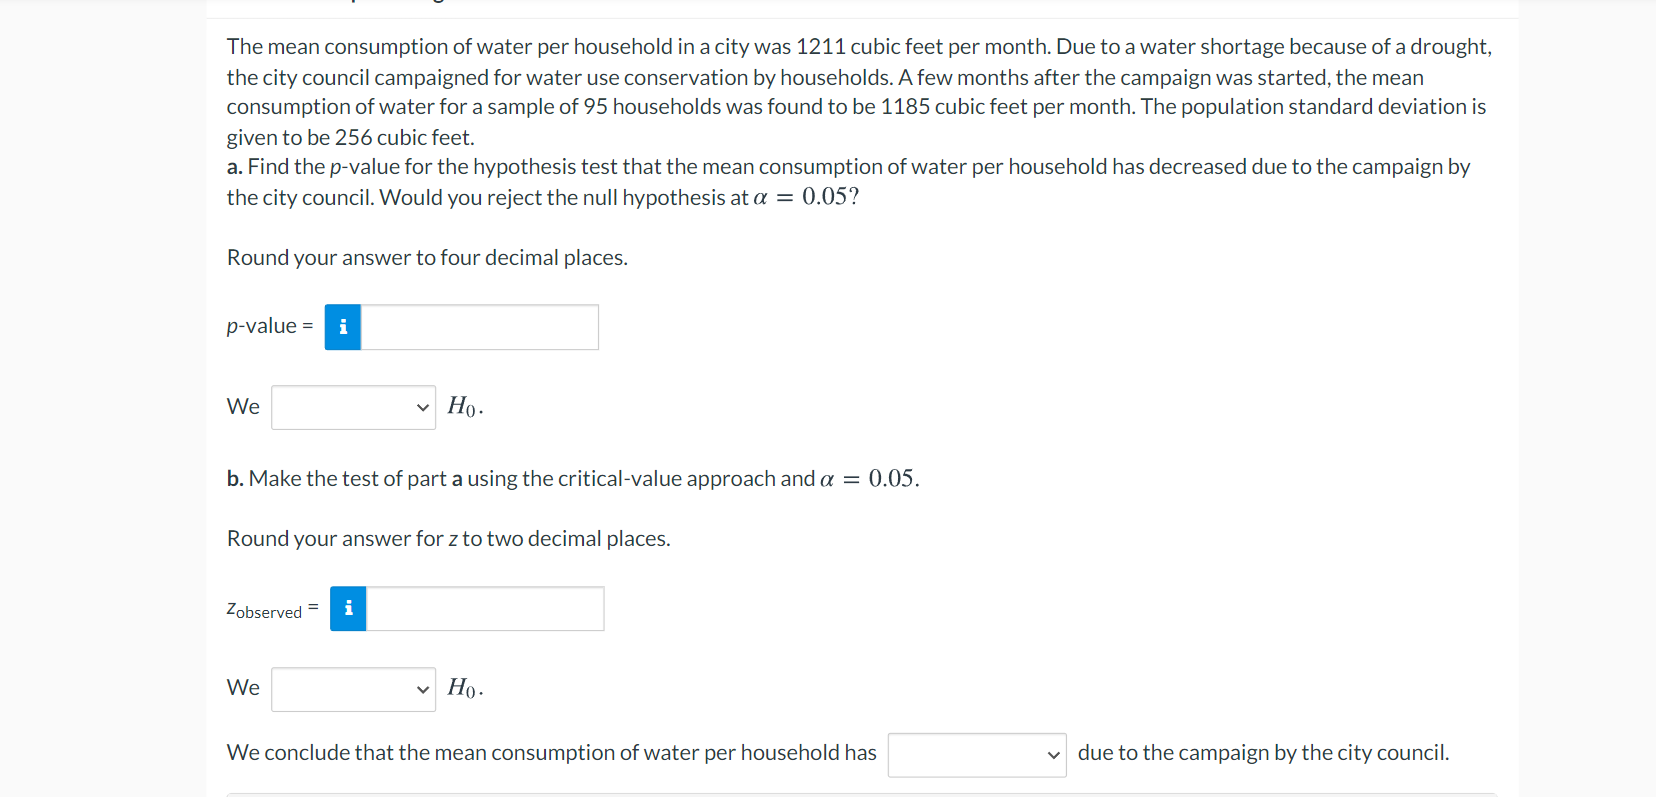
___. _____ _______'__ ___ _ _ -u- ___ Consider H0: ,u = 38 versus H11}; > 38. A random sample of 35 observations taken from this population produced a sample mean of 40.26. The population is normally distributed with o = 7.2. Calculate the pvalue. Round your answer to four decimal places. P = eTextbook and Media A random sample of 121 observations produced a sample mean of 31. Find the critical and observed values of z for the following test of hypothesis using a = 0.05. The population standard deviation is known to be 7 and the population distribution is normal. H0: [.1 = 28versusH1:,u g 28. Round your answers to two decimal places. zcritical left = n zcritical right = l Zobserved = n Consider H0: y = 38 versus H1: ,u > 38. A random sample of 35 observations taken from this population produced a sample mean of 40.26. The population is normally distributed with U = 7.2. Calculate the prvalue. Round your answer to four decimal places. P = I eTextbook and Media Fill in the table with "Type I error", "Type II error", or "Correct decision". Decision Ho true Ho false Reject Ho Type l error Correct decision v Retain Ho Correct decision v Type ll error vA past study claimed that adults in America spent an average of 18 hours a week on leisure activities. A researcher wanted to test this claim. She took a sample of 10 adults and asked them about the time they spend per week on leisure activities. Their responses (in hours) are as follows. 14.0 15.9 22.0 22.4 21.3 36.8 13 13.6 20.1 20.9 Assume that the times spent on leisure activities by all adults are normally distributed. Using the 5% signicance level, can you conclude that the average amount of time spent by American adults on leisure activities has changed? (Hint: First calculate the sample mean and the sample standard deviation for these data. Then make the test of hypothesis aboutpt.) Round the sample standard deviation to three decimal places. i = 5: The mean consumption of water per household in a city was 1211 cubic feet per month. Due to a water shortage because of a drought, the city council campaigned for water use conservation by households. Afew months after the campaign was started, the mean consumption ofwater for a sample of 95 households was found to be 1185 cubic feet per month. The population standard deviation is given to be 256 cubic feet. a. Find the pevalue for the hypothesis test that the mean consumption of water per household has decreased due to the campaign by the city council. Would you reject the null hypothesis at 05 = 005? Round your answer to four decimal places. pevalue = I We v H0. b. Make the test of part a using the criticalvalue approach and a: = 0.05. Round your answer for zto two decimal places. zobserved : n We v Ho. We conclude that the mean consumption of water per household has v due to the campaign by the city council
Step by Step Solution
There are 3 Steps involved in it
Step: 1
Get Instant Access to Expert-Tailored Solutions
See step-by-step solutions with expert insights and AI powered tools for academic success
Step: 2
Step: 3
Ace Your Homework with AI
Get the answers you need in no time with our AI-driven, step-by-step assistance