undefined

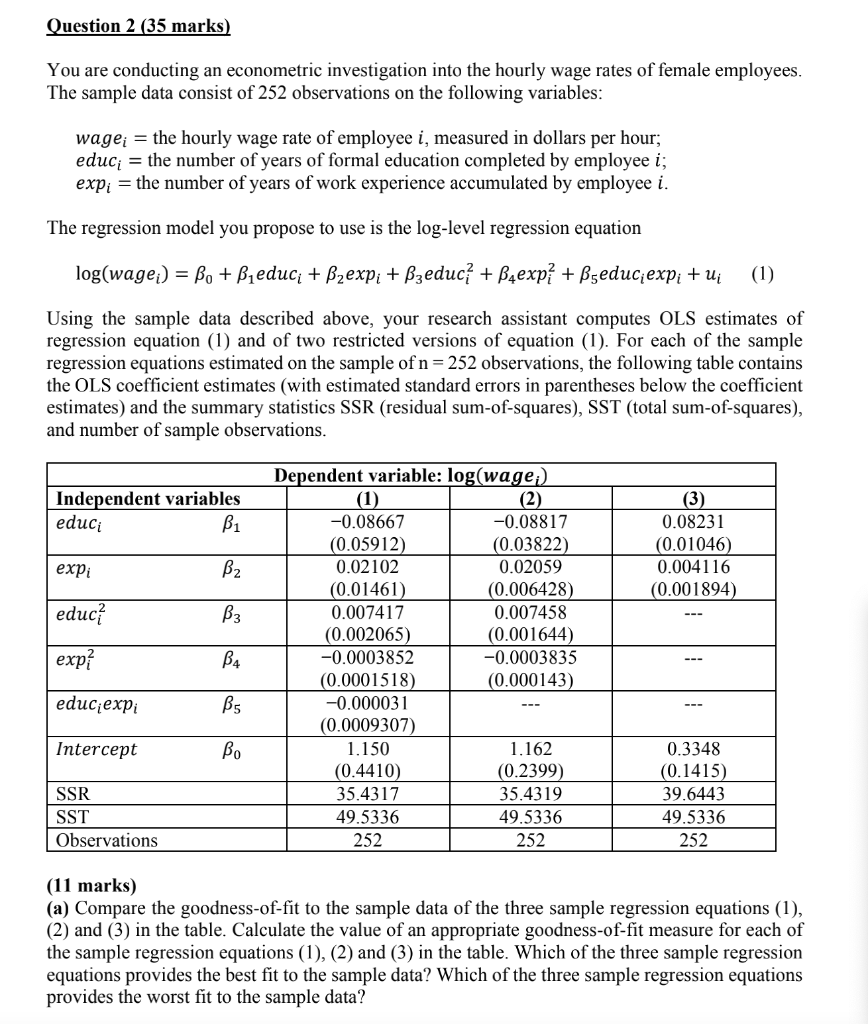
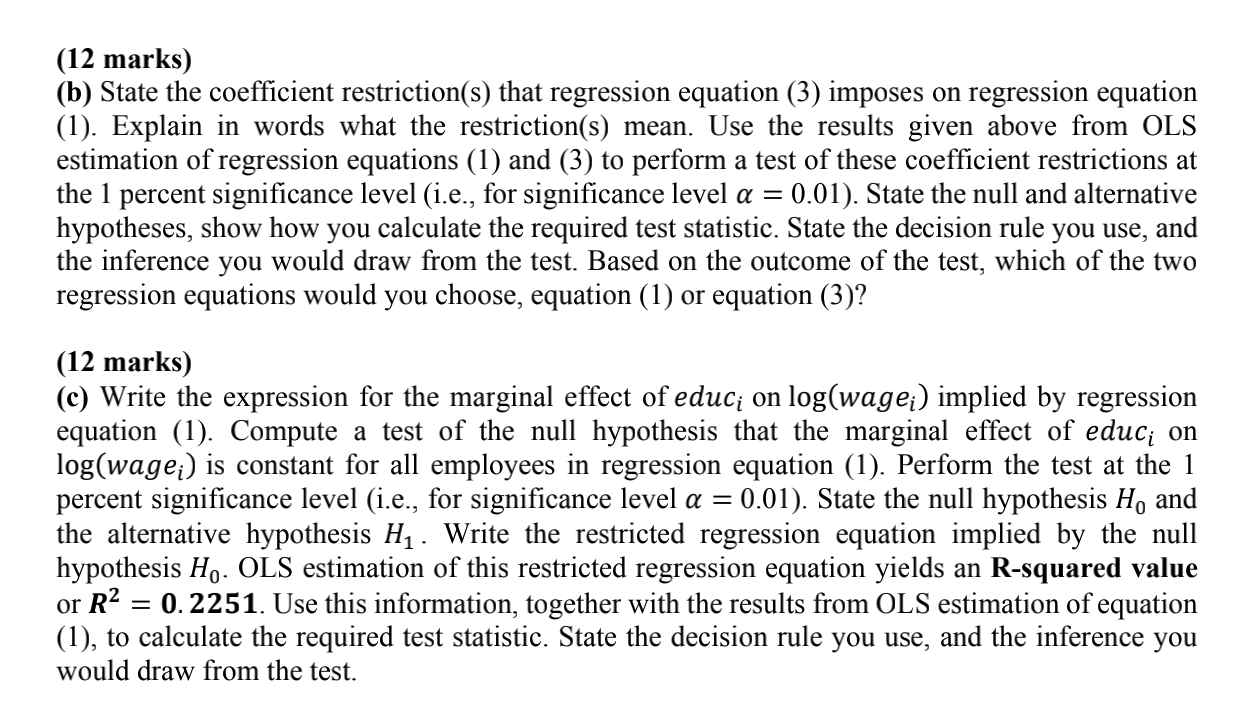
Question 2 (35 marks) You are conducting an econometric investigation into the hourly wage rates of female employees. The sample data consist of 252 observations on the following variables: wage; = the hourly wage rate of employee i, measured in dollars per hour; educ = the number of years of formal education completed by employee i; expi = the number of years of work experience accumulated by employee i. The regression model you propose to use is the log-level regression equation log(wage;) = Be + B,educi + Bzexpi + Bzeduc? + B4exp? +Bseduc;expi + u (1) Using the sample data described above, your research assistant computes OLS estimates of regression equation (1) and of two restricted versions of equation (1). For each of the sample regression equations estimated on the sample of n = 252 observations, the following table contains the OLS coefficient estimates (with estimated standard errors in parentheses below the coefficient estimates) and the summary statistics SSR (residual sum-of-squares), SST (total sum-of-squares), and number of sample observations. Independent variables educi Bi (3) 0.08231 (0.01046) 0.004116 (0.001894) expi B2 educ B3 exp? B4 Dependent variable: log(wage :) (1) (2) -0.08667 -0.08817 (0.05912) (0.03822) 0.02102 0.02059 (0.01461) (0.006428) 0.007417 0.007458 (0.002065) (0.001644) -0.0003852 -0.0003835 (0.0001518) (0.000143) -0.000031 (0.0009307) 1.150 1.162 (0.4410) (0.2399) 35.4317 35.4319 49.5336 49.5336 252 252 educiexpi B5 Intercept SSR SST Observations 0.3348 (0.1415) 39.6443 49.5336 252 (11 marks) (a) Compare the goodness-of-fit to the sample data of the three sample regression equations (1), (2) and (3) in the table. Calculate the value of an appropriate goodness-of-fit measure for each of the sample regression equations (1), (2) and (3) in the table. Which of the three sample regression equations provides the best fit to the sample data? Which of the three sample regression equations provides the worst fit to the sample data? (12 marks) (b) State the coefficient restriction(s) that regression equation (3) imposes on regression equation (1). Explain in words what the restriction(s) mean. Use the results given above from OLS estimation of regression equations (1) and (3) to perform a test of these coefficient restrictions at the 1 percent significance level (i.e., for significance level a = 0.01). State the null and alternative hypotheses, show how you calculate the required test statistic. State the decision rule you use, and the inference you would draw from the test. Based on the outcome of the test, which of the two regression equations would you choose, equation (1) or equation (3)? (12 marks) (c) Write the expression for the marginal effect of educi on log(wage;) implied by regression equation (1). Compute a test of the null hypothesis that the marginal effect of educi on log(wage;) is constant for all employees in regression equation (1). Perform the test at the 1 percent significance level (i.e., for significance level a = 0.01). State the null hypothesis H, and the alternative hypothesis H . Write the restricted regression equation implied by the null hypothesis H. OLS estimation of this restricted regression equation yields an R-squared value or R2 = 0.2251. Use this information, together with the results from OLS estimation of equation (1), to calculate the required test statistic. State the decision rule you use, and the inference you would draw from the test. Question 2 (35 marks) You are conducting an econometric investigation into the hourly wage rates of female employees. The sample data consist of 252 observations on the following variables: wage; = the hourly wage rate of employee i, measured in dollars per hour; educ = the number of years of formal education completed by employee i; expi = the number of years of work experience accumulated by employee i. The regression model you propose to use is the log-level regression equation log(wage;) = Be + B,educi + Bzexpi + Bzeduc? + B4exp? +Bseduc;expi + u (1) Using the sample data described above, your research assistant computes OLS estimates of regression equation (1) and of two restricted versions of equation (1). For each of the sample regression equations estimated on the sample of n = 252 observations, the following table contains the OLS coefficient estimates (with estimated standard errors in parentheses below the coefficient estimates) and the summary statistics SSR (residual sum-of-squares), SST (total sum-of-squares), and number of sample observations. Independent variables educi Bi (3) 0.08231 (0.01046) 0.004116 (0.001894) expi B2 educ B3 exp? B4 Dependent variable: log(wage :) (1) (2) -0.08667 -0.08817 (0.05912) (0.03822) 0.02102 0.02059 (0.01461) (0.006428) 0.007417 0.007458 (0.002065) (0.001644) -0.0003852 -0.0003835 (0.0001518) (0.000143) -0.000031 (0.0009307) 1.150 1.162 (0.4410) (0.2399) 35.4317 35.4319 49.5336 49.5336 252 252 educiexpi B5 Intercept SSR SST Observations 0.3348 (0.1415) 39.6443 49.5336 252 (11 marks) (a) Compare the goodness-of-fit to the sample data of the three sample regression equations (1), (2) and (3) in the table. Calculate the value of an appropriate goodness-of-fit measure for each of the sample regression equations (1), (2) and (3) in the table. Which of the three sample regression equations provides the best fit to the sample data? Which of the three sample regression equations provides the worst fit to the sample data? (12 marks) (b) State the coefficient restriction(s) that regression equation (3) imposes on regression equation (1). Explain in words what the restriction(s) mean. Use the results given above from OLS estimation of regression equations (1) and (3) to perform a test of these coefficient restrictions at the 1 percent significance level (i.e., for significance level a = 0.01). State the null and alternative hypotheses, show how you calculate the required test statistic. State the decision rule you use, and the inference you would draw from the test. Based on the outcome of the test, which of the two regression equations would you choose, equation (1) or equation (3)? (12 marks) (c) Write the expression for the marginal effect of educi on log(wage;) implied by regression equation (1). Compute a test of the null hypothesis that the marginal effect of educi on log(wage;) is constant for all employees in regression equation (1). Perform the test at the 1 percent significance level (i.e., for significance level a = 0.01). State the null hypothesis H, and the alternative hypothesis H . Write the restricted regression equation implied by the null hypothesis H. OLS estimation of this restricted regression equation yields an R-squared value or R2 = 0.2251. Use this information, together with the results from OLS estimation of equation (1), to calculate the required test statistic. State the decision rule you use, and the inference you would draw from the test


